
通过 WPF 绘制三角函数
4.20/5 (2投票s)
演示如何编写 C# 通过 WPF 引擎进行绘制的文章。
引言
任何见过正弦波和/或余弦波的人都会注意到,这两个曲线图都是在笛卡尔坐标(世界)系中绘制的。原点 (0,0) 位于图形的中间,因为图形的周期为 2PI 或宽度为 -PI 到 +PI。 然而,与该系统不同的是控制台终端的 X 和 Y 坐标系:原点 (0,0) 位于左上角,在许多旧终端上,这是 VGA 缓冲器的位置。 对于 2D 图形,WPF 坐标系将原点定位在渲染区域的左上角。 在 2D 空间中,正 X 轴指向右侧,正 Y 轴向下指向。 默认 WPF 系统中的所有坐标和大小都以每英寸 96 个点 (DPI) 为单位进行测量,称为设备无关像素。 在此系统中,您可以创建自适应布局以处理不同的分辨率,确保您的控件和图形对象在窗口拉伸时相应地拉伸。 那么代码如何确保我们可以绘制正弦波和/或余弦波呢?
创建此折线图的关键一步是,需要将世界坐标系中的原始数据点转换为设备无关像素单位的点。 因此,我们必须编写一种方法,将世界坐标系中任何单位的点转换为设备坐标系中设备无关像素单位的点。 那么代码会是什么样子呢? 它将有一个在代码隐藏文件中访问并编译为 DLL 的方法。 我们将该方法命名为 CurvePoint,并注意其访问修饰符为 private 和 static
using System;
using System.Collections.Generic;
using System.Text;
using System.Windows;
using System.Windows.Controls;
using System.Windows.Data;
using System.Windows.Documents;
using System.Windows.Input;
using System.Windows.Media;
using System.Windows.Media.Imaging;
using System.Windows.Shapes;
namespace MyProject
     {
    public partial class SimpleLineChart : Window
          {
            private double xmin = 0;

            private double xmax = 6.5;
            private double ymin = -1.1;
            private double ymax = 1.1;
            private Polyline pl;

            public SimpleLineChart()
            {
              InitializeComponent();
              AddChart();
             }

          private void AddChart()
            {
                // Draw sine curve:
               pl = new Polyline();
               pl.Stroke = Brushes.Black;
               for (int i = 0; i < 70; i++)
                {
                   double x = i/5.0;
                   double y = Math.Sin(x);
                     pl.Points.Add(CurvePoint(
                     new Point(x, y)));
                 }
             chartCanvas.Children.Add(pl);
              // Draw cosine curve:
                 pl = new Polyline();
               pl.Stroke = Brushes.Black;
               pl.StrokeDashArray = new DoubleCollection(
               new double[] { 4, 3 });
                for (int i = 0; i < 70; i++)
                 {
                   double x = i / 5.0;
                   double y = Math.Cos(x);
                   pl.Points.Add(CurvePoint(
                   new Point(x, y)));
                  }
                   chartCanvas.Children.Add(pl);
             }
        private Point CurvePoint(Point pt)
          {
             Point result = new Point();
             result.X = (pt.X - xmin) * chartCanvas.Width / (xmax - xmin);
             result.Y = chartCanvas.Height - (pt.Y - ymin) * chartCanvas.Height
             /  (ymax - ymin);
             return result;
        }
   }
}
这是使用 Expression Blend 4 构建应用程序时应用程序的外观
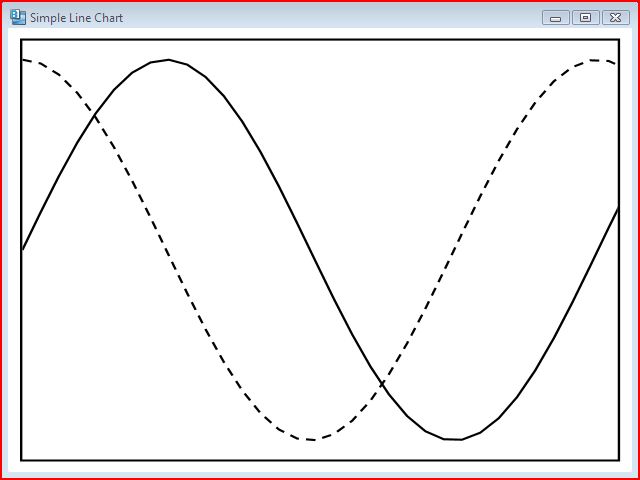
诚然,对于那些不需要三角学的人来说,这张图画没有太多的意义,但它确实展示了代码如何在 WPF 中创建对象,而无需大量的 XAML。
XAML 在哪里?
XAML 简单明了
<Window
xmlns="http://schemas.microsoft.com/winfx/2006/xaml/presentation"
xmlns:x="http://schemas.microsoft.com/winfx/2006/xaml"
x:Class="MyProject.SimpleLineChart"
Title="Simple Line Chart"
Width="640" Height="480">
<Viewbox Stretch="Fill">
<Border BorderBrush="Black" BorderThickness="1" Margin="5">
<Canvas Name="chartCanvas"
Width="250" Height="200" ClipToBounds="True"/>
</Border>
</Viewbox>
</Window>
本文参考了 Jack Xu 的作品。
历史
- 2010 年 8 月 26 日:初始帖子