
使用 SVG/CSS 进行 VisualBasic 混合 GIS 数据可视化
应用于数据科学的新 VB.NET 语言
- 下载 GIS_render
- 下载 Data.GIS-1.1.1
- 从 GitHub 下载最新源代码: https://github.com/xieguigang/Data.GIS
为了进一步开发此程序,请先从 nuget 安装 Microsoft VisualBasic CLI App 运行时
PM> Install-Package VB_AppFramework -Pre
然后,添加对这些 DLL 模块的引用
- Microsoft.VisualBasic.Architecture.Framework_v3.0_22.0.76.201__8da45dcd8060cc9a.dll
- Microsoft.VisualBasic.Data.Csv.dll
- Microsoft.VisualBasic.Imaging.dll
- Microsoft.VisualBasic.MIME.Markup.dll
致谢
本文中所有的编程思路都来源于网站 VISUAL CINNAMON 上的这篇文章。
Using the Code
1. 空白世界地图 SVG
引用
来源:维基百科: File:BlankMap-World6.svg
这是我从维基百科下载并进行了一些调整的空白地图数据:删除了小的区域圆圈以解决 GIMP 渲染问题,并移除了海洋的多边形路径数据,所以最终的地图看起来像这样
![]()
此修改后的空白地图 SVG 数据可在 我的 GitHub 存储库中找到。
2. 如何在 SVG 多边形上渲染颜色?
通过观察空白世界地图数据中 SVG 元素的结构,我们可以知道所有的 svg 图形对象 g 和多边形对象 path 都具有用于应用 CSS 样式的 style 属性,以及用于标识国家或地区的 id 属性,这是一个 SVG 文档的例子
<g style="fill: rgb(204,0,0);" id="fr">
   ...
   <path style="fill: rgb(204,0,0);" class="landxx fr gf eu" id="gf" d="..." />
   <title>France</title>
</g>
因此,我们所要做的就是通过 `id` 属性找到国家或地区对象,然后计算该对象的映射颜色,并将 CSS 值字符串设置为 `style` 属性,这样我们就可以完成渲染工作了。
3. 颜色渲染器
使用 ISO-3166_1 找到 SVG 对象
空白世界地图 SVG 中的多边形对象使用 iso-3166 alpha2 代码作为标识符,但问题在于,在大多数情况下,我们输入数据时使用的是国家名称而不是这个简短的代码,所以我们使用一个字典来将国家名称或其他简短代码转换为所需的 iso-3166 alpha2 代码
Imports Microsoft.VisualBasic.Serialization.JSON

Public Class ISO_3166

    Public Property name As String
    Public Property alpha2 As String
    Public Property alpha3 As String
    Public Property code As String

    Public Overrides Function ToString() As String
        Return Me.GetJson
    End Function
End Class
创建这个字典将使输入的国家名称与 ISO-3166_1 数据中的所有字段兼容。然后,通过使用这个字典,我们可以将输入关键字转换为 iso-3166-1 alpha2 代码,以便查找 SVG 图形或路径对象。
Public ReadOnly statDict As Dictionary(Of String, String)

statDict = (From x As ISO_3166
            In __iso_3166
            Select {
                x.name.ToLower,
                x.alpha2,
                x.alpha3,
                x.code}.Select(Function(code) New With {
                    .code = code,
                    .alpha2 = x.alpha2
                })).MatrixAsIterator.ToDictionary(
                    Function(x) x.code,
                    Function(x) x.alpha2)
因此,通过使用 iso-3166 alpha2 代码,我们可以使用以下代码在地图 SVG 数据中找到任何 `country` 对象
''' <summary>
''' thanks to the XML/HTML style of the SVG (and Nathan’s explanation) I can create CSS
''' classes per country
''' (the polygons of each country uses the alpha-2 country code as a class id)
''' </summary>
''' <param name="map"></param>
''' <param name="code"></param>
''' <returns></returns>
<Extension>
Private Function __country(map As SVGXml, code As String) As node
    Dim alpha2 As String =
        If(statDict.ContainsKey(code),
        statDict(code),
        statDict.TryGetValue(code.ToLower))
    Dim c As node = map.gs.__country(alpha2)

    If c Is Nothing Then
        c = map.path.__country(alpha2)

        If c Is Nothing Then
            Call $"Unable found Object named '{code}'!".PrintException
        End If
    End If

    Return c
End Function

<Extension>
Private Function __country(subs As path(), alpha2 As String) As path
    For Each path As path In subs.SafeQuery
        If path.id.TextEquals(alpha2) Then
            Return path
        End If
    Next

    Return Nothing
End Function

<Extension>
Private Function __country(subs As g(), alpha2 As String) As node
    Dim state As New Value(Of node)

    For Each c As g In subs
        If alpha2.TextEquals(c.id) Then
            Return c
        Else
            If c.gs.IsNullOrEmpty Then
                Continue For
            End If
        End If

        If Not (state = c.gs.__country(alpha2)) Is Nothing Then
            Return state
        End If

        If Not (state = c.path.__country(alpha2)) Is Nothing Then
            Return state  ' fix error for GF island
        End If
    Next

    Return Nothing
End Function
级别映射
通过测量值 x 与向量元素最小值之间的差值,然后将差值除以输入向量的最大值和最小值之间的极值距离来计算比例,我们可以对输入数据进行线性比例映射
For Each x As Double In array
    Dim lv As Integer = CInt(Level * (x - MinValue) / d)
    chunkBuf(++i) = lv + offset
Next
这是 VisualBasic 中定义的线性映射函数: `Microsoft.VisualBasic.Mathematical::ScaleMaps.GenerateMapping(System.Collections.Generic.IEnumerable(Of Double), Integer, Integer) As Integer()`
''' <summary>
''' Linear mappings the vector elements in to another scale within specific range from
''' parameter <paramref name="Level"></paramref>.
''' </summary>
''' <param name="data">Your input numeric vector.</param>
''' <param name="Level">The scaler range.</param>
''' <returns></returns>
''' <param name="offset">
''' The default scaler range output is [1, <paramref name="Level"></paramref>],
''' but you can modify this parameter value for moving the range to
''' [<paramref name="offset"></paramref>, <paramref name="Level"></paramref> +
''' <paramref name="offset"></paramref>].
''' </param>
<ExportAPI("Ranks.Mapping")>
<Extension> Public Function GenerateMapping(data As IEnumerable(Of Double), _
            Optional Level As Integer = 10, Optional offset As Integer = 1) As Integer()
    Dim array As Double() = data.ToArray
    Dim MinValue As Double = array.Min
    Dim MaxValue As Double = array.Max
    Dim d As Double = MaxValue - MinValue

    If d = 0R Then
        Return 1.CopyVector(array.Length)
    End If

    Dim chunkBuf As Integer() = New Integer(array.Length - 1) {}
    Dim i As int = 0

    For Each x As Double In array
        Dim lv As Integer = CInt(Level * (x - MinValue) / d)
        chunkBuf(++i) = lv + offset
    Next

    Return chunkBuf
End Function
生成颜色图案

此工具中的颜色图有八种图案,可以从渲染函数的 `mapName` 参数中指定
''' <summary>
''' Spring
''' </summary>
Public Const PatternSpring As String = "Spring"
''' <summary>
''' Summer
''' </summary>
Public Const PatternSummer As String = "Summer"
''' <summary>
''' Autumn
''' </summary>
Public Const PatternAutumn As String = "Autumn"
''' <summary>
''' Winter
''' </summary>
Public Const PatternWinter As String = "Winter"
''' <summary>
''' Jet
''' </summary>
Public Const PatternJet As String = "Jet"
''' <summary>
''' Gray
''' </summary>
Public Const PatternGray As String = "Gray"
''' <summary>
''' Hot
''' </summary>
Public Const PatternHot As String = "Hot"
''' <summary>
''' Cool
''' </summary>
Public Const PatternCool As String = "Cool"
颜色图案生成代码可以在这个 CodeProject 文章中找到
引用"在 C# 中创建自定义颜色图": https://codeproject.org.cn/Articles/18150/Create-Custom-Color-Maps-in-C
此外,还提供了另外三种颜色图案,这些图案来自 R 脚本的结果,并且 `render` 函数使用这个 R 生成的颜色图案,具有 256 个映射级别深度
require(fields)

# Loading required package: fields
# Loading required package: spam
# Loading required package: grid
# Spam version 1.3-0 (2015-10-24) is loaded.
# Type 'help( Spam)' or 'demo( spam)' for a short introduction
# and overview of this package.
# Help for individual functions is also obtained by adding the
# suffix '.spam' to the function name, e.g. 'help( chol.spam)'.
#
# Attaching package: ‘spam’
#
# The following objects are masked from ‘package:base’:
#
#     backsolve, forwardsolve
#
# Loading required package: maps
#
#   maps v3.1: updated 'world': all lakes moved to separate new #
#   'lakes' database. Type '?world' or 'news(package="maps")'.  #

designer.colors(n=10, col=c("#CCEBC5", "#A8DDB5", "#7BCCC4", "#4EB3D3", "#08589E", "#08589E"))
designer.colors(n=256, col=c("#CCEBC5", "#A8DDB5", "#7BCCC4", "#4EB3D3", "#08589E", "#08589E"))
designer.colors(n=512, col=c("#CCEBC5", "#A8DDB5", "#7BCCC4", "#4EB3D3", "#08589E", "#08589E"))
填充多边形颜色
如上所述,SVG 图像中的所有图形和路径对象都有一个用于应用 CSS 样式的属性,名为 style,因此我们只需将 CSS fill 样式赋值给此属性,即可将特定颜色填充到目标多边形对象中。这是代码
<Extension> Public Sub FillColor(ByRef g As node, color As String)
    g.style = $"fill: {color};"  ' path/g

    If TypeOf g Is g Then
        Dim x As g = DirectCast(g, g)

        For Each [sub] As g In x.gs.SafeQuery
            Call [sub].FillColor(color)
        Next

        For Each path As path In x.path.SafeQuery
            path.style = g.style
        Next
    End If
End Sub
将图像插入 SVG

最后,我们可以渲染带有各种颜色的地图,并且我们需要一个图例来指示这些颜色的含义。使用 gdi+ 绘制图例非常简单,将生成的图例图像嵌入到 Svg 图像中也很容易。关于如何将图像嵌入 SVG,请参阅 此 stackoverflow 问题。
这是 Visual Basic 中定义的 svg 图像对象
Public Class Image

    <XmlAttribute> Public Property x As Double
    <XmlAttribute> Public Property y As Double
    <XmlAttribute> Public Property width As String
    <XmlAttribute> Public Property height As String
    <XmlAttribute("image.data")> Public Property data As String

    ''' <summary>
    ''' ``data:image/png;base64,...``
    ''' </summary>
    Const base64Header As String = "data:image/png;base64,"

    Sub New()
    End Sub

    Sub New(image As Bitmap, Optional size As Size = Nothing)
        data = base64Header & image.ToBase64String
        If size.IsEmpty Then
            size = image.Size
        End If
        width = size.Width
        height = size.Height
    End Sub
End Class
并且在 `DrawLegend` 函数输出图例图像后,我们可以创建一个 svg 图像对象,并通过计算 x 和 y 位置值将其放置在 svg 图像上的特定位置。
legend = designer.DrawLegend(title)
renderedMap.images = {
    New SVG.Image(legend) With {
        .height = legend.Height * 0.5,
        .width = legend.Width * 0.5,
        .x = .width / 2,
        .y = renderedMap.height - .height
    }
}
示例
此地图颜色渲染模块的演示 CLI 工具可以在附件中找到。
CLI 工具
<ExportAPI("/Rendering",
           Usage:="/Rendering /in <data.csv> [/main <title>
           /legend.title <legend title> /map.levels <512> /map <map.svg>
           /map.Name <default> /out <out.svg>]")>
<ParameterInfo("/in", False,
               AcceptTypes:={GetType(Data)},
               Description:="A data file template example can be found in the
                             ./Templates/ folder.")>
<ParameterInfo("/map.levels", True, AcceptTypes:={GetType(Integer)},
               Description:="Any positive integer value,
                             this will adjust the color depth for the value mappings.")>
<ParameterInfo("/map", True,
               Description:="User custom map svg,
                             please note that the id attribute of the ``g`` or
                             ``path`` object in the svg stands for the country
                             for region should be the iso-3166-1 alpha2 code.")>
<ParameterInfo("/map.Name", True, AcceptTypes:={GetType(String)},
               Description:="The color map pattern profile name,
                             the VisualBasic language build in color patterns name
                             can be found at github:
                          https://github.com/xieguigang/VisualBasic_AppFramework/tree/master/gr
               And this value is set as ``default`` if this parameter is not specified,
               in this situation,
               the parameter value of /map.levels is only allowed 256 or 512.")>
Public Function Rendering(args As CommandLine) As Integer
    Dim [in] As String = args("/in")
    Dim map As String = args("/map")
    Dim iso_3166 As String = args("/iso_3166")
    Dim levels As Integer = args.GetValue("/map.levels", 512)
    Dim mapName As String = args.GetValue("/map.Name", "default")
    Dim main As String = args("/main")
    Dim out As String = args.GetValue(
        "/out",
        [in].TrimSuffix & $".rendering;levels={levels},map.Name={mapName}.svg")
    Dim data As IEnumerable(Of Data) = [in].LoadCsv(Of Data)
    Dim legend As Bitmap = Nothing
    Dim legendTitle As String = args.GetValue("/legend.title", "Legend title")
    Dim svg As SVGXml = data.Rendering(
        levels,
        mapTemplate:=map.ReadAllText(throwEx:=False, suppress:=True),
        mapName:=mapName,
        legend:=legend,
        title:=legendTitle)
    If Not String.IsNullOrEmpty(main) Then
        svg.title = main
    End If
    Return svg.SaveAsXml(out).CLICode
End Function
CLI 用法
GIS_render /Rendering /in <data.csv> [/main <title> /legend.title <legend title>
/map.levels <512> /map <map.svg> /iso_3166 <iso_3166.csv> /map.Name <default> /out <out.svg>]
画廊
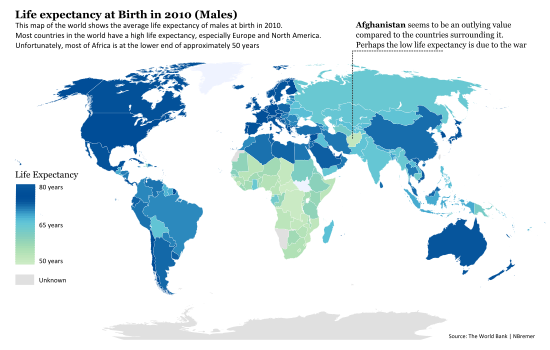
测试数据:出生时预期寿命,男性(岁)
API_SP.DYN.LE00.MA.IN_DS2_en_csv_v2 数据是从世界银行下载的: http://data.worldbank.org/indicator/SP.DYN.LE00.MA.IN,使用 2012 年作为 Data.value。
#!/bin/bash

../GIS_render.exe /rendering /in ./API_SP.DYN.LE00.MA.IN_DS2.csv /map.name Summer /map.levels 512
../GIS_render.exe /rendering /in ./API_SP.DYN.LE00.MA.IN_DS2.csv /map.name Jet /map.levels 20
测试渲染,使用 /map.levels = 512; /map.Name = Summer

测试渲染,使用 /map.levels = 20; /map.Name = Jet

在 Linux 上测试
示例 CLI 工具已在 Ubuntu 系统上成功测试

历史
- 2016 年 9 月 26 日:初版