
Visual Basic 中的逻辑回归分类
机器学习。什么语言会浮现在脑海里?R?Python?Matlab?我敢打赌你没想过 Visual Basic。
引言
逻辑回归是一种令人兴奋的统计学方法,它允许我们在因变量是分类变量时,发现数据中的关系。因此,它吸引了许多统计学家的目光,以至于我的学校用它来帮助他们预测 A-level 成绩。
在本文中,我们将讨论一种简单的二元(仅输出“是”或“否”)逻辑回归在 Visual Basic 中的实现,并用它来根据电子表格中的数据进行预测。
背景
超级重要术语
假设 (Hypothesis) – 我们如何预测某事物的运作方式(例如,“我假设身高、年龄和体重之间的关系由函数 w = 5h + 2a + 1 给出”)。
参数向量 (Parameter Vector) – 包含你假设的系数的向量(例如,在之前的体重-身高模型中,5、2 和 1 包含在参数向量中)。它们有时会用希腊字母 θ 表示。
特征 (Feature) – 对被观测现象的可测量属性(例如,在之前的体重-身高模型中,身高和年龄是特征)。
似然度 (Likelihood) – 在给定参数向量的情况下,使用某个假设得到某个数据集的概率。
后验概率 (Posterior Probability) – 在给定数据集的情况下,获得具有某个参数向量的某个假设的概率。
如何将参数向量和值转化为假设?
很简单。
以体重预测器为例,设 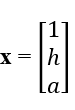 和
和  。
。
我们想得到 w = 5h + 2a + 1。嗯。
如果我们乘以 x 中的每个元素与其在 **θ** 中的对应元素,我们会得到
h(x) = 1*1 + 5*h + 2*a
更抽象地说,对于  和
和  ,我们的假设是
 ![]() 。
。
这可以通过 `for` 循环完成,或者,如果你想做得更巧妙,可以使用矩阵乘法 (**x**T**θ**)。
如何将假设转化为预测?
现在我们有了假设,我们需要做出预测——我们需要找到一种函数,将 h(x) 映射到 1 和 0 之间的某个值(分别代表“是”和“否”)。碰巧,一位名叫 Pierre François Verhulst 的数学家在研究人口增长时,恰好找到了这样一个函数:标准的逻辑函数(也称为“sigmoid”函数,因为它看起来像一个“s”)。

我们只需将我们的假设代入即可获得预测。如果函数不确定,它会返回一个分数:0.9 表示它很有可能是一个 1;0.4 是一个不太确定的 0。
等一下,θ 的值是怎么来的?
假设我们有训练示例数据,现在我们面临一个优化问题:找到 θ 的值,以最小化我们预测中的错误(从而优化我们的模型)。这个问题可以分解为两部分:
第一部分:我们错了多少?
对于每个向量 θ,我们需要计算基于这些值的模型错误程度。我们将使用的误差度量是负对数似然。
我们这样定义它:

这些情况的图表如下所示:

其中红线显示 ![]() 。我们可以看到,函数在 x = 0 和 x = 1 处有渐近线,并且它们会严厉惩罚错误预测(当 y = 0 但我们预测了类似 0.9 时)。我们可以将这些表达式合并:
。我们可以看到,函数在 x = 0 和 x = 1 处有渐近线,并且它们会严厉惩罚错误预测(当 y = 0 但我们预测了类似 0.9 时)。我们可以将这些表达式合并:

其中 N 是 **x** 中的示例数,yi 是 **y** 中的第 i 个值,xi 是 **x** 中的第 i 个示例。
请注意,当 yi = 0 时,求和的第一项变为 0;当 yi = 1 时,第二项变为 0。我们取对数变换是为了使函数更容易处理——可能会出现下溢的小数会变得不那么小;乘法变成加法。你可以在这里找到一个非常好的推导:http://www.robots.ox.ac.uk/~az/lectures/ml/2011/lect4.pdf。
第二部分:如何停止犯错?
要停止犯错,我们必须最小化我们的错误。最直观的方法之一就是利用初等微积分。逻辑回归的负对数似然函数可以被证明是凹函数——也就是说,存在一个唯一的全局最优值。
因此,我们对所有 **θ** 取偏导数,将它们乘以学习率(步长) α,然后从它们各自的原始值中减去: ,其中 f 代表某个特征。多次迭代这个过程,基本上就是让我们更接近最优值——就像滑板手从山谷上滚下来一样——其中所有 **θ** 都有
  。
。
在我们的逻辑函数的情况下,可以通过链式法则轻松获得导数。

因此,我们得到以下更新函数:
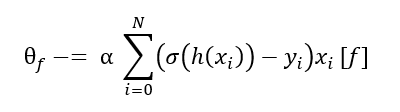
其中 f 是一个特征,α 是学习率,xi [f] 是示例 xi 中特征 f 的值。
总而言之,我们的算法如下所示:
对所有特征重复执行

如果梯度在合理阈值内,则退出循环。
优化优化器
我们可以看到,当接近最优值时,收敛速度会减慢。这是因为偏导数趋近于 0,步长变得非常小。我们可以通过对算法进行以下调整来抵消这一点:
- 将每个特征的平方偏导数记录在一个数组
 中。
中。 - 将每个特征的学习率除以最近 10 个偏导数之和的平方根。
这会在我们接近收敛时动态地改变学习率。
通过归一化所有特征,我们可以进一步加快收敛速度。我们也可以采用随机方法,在遍历每个训练示例后更新参数向量,尽管这种方法收敛得“不太好”。
需要更快的速度?
使用不同的算法,但请记住:矩阵求逆是费力的。牛顿法在有像样的线性代数库的情况下相当容易实现。
Using the Code
CSV 数据使用 `Load()` 方法加载。数据应在顶行包含标题。
Load("path/to/my_file_name.csv")
我们的逻辑函数和误差成本函数实现如下:
Function LogisticFunction(x)
    'Compute the value of the logistic function given input x
    'a sigmoid function has an S shape and is given by 1/(e^(-t))
    'e = 2.71... (Euler's number)

    Return (1 / (1 + Math.Exp(-x)))

End Function

Function LogisticCost()

    Dim cost As Double

    'Loop through all the training examples
    For i = 0 To exampleCount - 1

        Dim exampleCost As Double

        If exampleOutputs(i) = 0 Then
            exampleCost = Math.Log(1 - LogisticFunction(Hypothesis(exampleInputs(i))))
        Else
            exampleCost = Math.Log(LogisticFunction(Hypothesis(exampleInputs(i))))
        End If

        cost += exampleCost

    Next

    'Take average
    cost *= -1 / exampleCount

    Return Math.Abs(cost)

End Function
我们的优化算法在这里实现:
Sub Minimise()

    'Simple implementation of adagrad bc no way in hell
    'am I implementing bfgs or anything that requires the hessan
    'gradient = X'(h(x) - y)

    Dim learningRate As New List(Of Double)
    Dim derivative As New List(Of Double)
    Dim pastGradientSquares As New List(Of List(Of Double))
    Dim sumOfPastGradientSquares As New List(Of Double)

    'Initialise all the variables
    For i = 0 To featureCount
        derivative.Add(1)
        learningRate.Add(0.01)
        sumOfPastGradientSquares.Add(0)
        pastGradientSquares.Add(New List(Of Double))
    Next

    lastCost = LogisticCost()
    deltaCost = 100

    'Do this until we converge (the derivative = 0ish)
    While (Math.Abs(deltaCost) > desiredDelta)

        Dim difference As New List(Of Double)
        Dim h As New List(Of Double)

        'Reset the derivative
        For i = 0 To thetas.Count
            derivative(i) = 0
        Next

        'Loop through the hypotheses and populate the list h

        For i = 0 To exampleCount - 1
            h.Add(LogisticFunction(Hypothesis(exampleInputs(i))))
        Next

        'Get the difference

        For i = 0 To exampleCount - 1
            difference.Add(h(i) - exampleOutputs(i))
        Next

        'Multiply by the features

        For i = 0 To exampleCount - 1
            For j = 0 To featureCount - 1
                derivative(j) += difference(i) * exampleInputs(i)(j)

                'Update the list of previous squared derivatives
                pastGradientSquares(j).Add(Math.Pow(derivative(j), 2))

                'If we exceed 10 things, just remove the oldest entry
                If pastGradientSquares(j).Count > 10 Then
                    pastGradientSquares(j).RemoveAt(0)
                End If

                'Update the sums
                sumOfPastGradientSquares(j) = Sum(pastGradientSquares(j))

            Next
        Next

        'Multiply by Learning Rate for this specific feature and get new thetas

        For i = 0 To featureCount - 1
            thetas(i) -= (learningRate(i) / _
            (Math.Sqrt(sumOfPastGradientSquares(i) + 0.00000001))) * derivative(i)
        Next

        Dim currentCost = LogisticCost()
        deltaCost = currentCost - lastCost

        'We need to look like we're doing something
        'so here's something to keep users occupied
        Console.WriteLine("Training...  " + LogisticCost().ToString + _
                          " " + derivative(0).ToString) ' + " " + _
                          derivative(1).ToString + " " + derivative(2).ToString)

        lastCost = currentCost

    End While

End Sub
我们可以这样快速获得预测:
Function Predict(x)

    Return LogisticFunction(Hypothesis(x))

End Function
并且可以这样查看我们的分类器表现如何:
Sub Check()

    Dim correctlyClassified As Double = 0

    'Loop through results and see how many were classified correctly
    For i = 0 To exampleInputs.Count - 1

        Dim result As String
        If Predict(exampleInputs(i)) > 0.5 Then
            result = "Positive"
            If exampleOutputs(i) = 1 Then
                correctlyClassified += 1
            End If
        Else
            result = "Negative"
            If exampleOutputs(i) = 0 Then
                correctlyClassified += 1
            End If
        End If

        Dim trueClassification As String
        If exampleOutputs(i) = 1 Then
            trueClassification = "Positive"
        Else
            trueClassification = "Negative"
        End If

        Console.WriteLine(result + " and was actually " + trueClassification)

    Next

    Console.WriteLine("Correctly Classified " + _
       correctlyClassified.ToString + " out of " + exampleInputs.Count.ToString)

End Sub
演示
该分类器是在虚构数据上训练的,以模拟一些现实生活中的情况。使用以下数据,构建了一个模型来预测汽车碰撞,预测因素包括驱动轮、汽车年龄和天气状况。

由此产生的预测看起来有点像这样:


另一个数据集被用来预测学生是否会通过考试,预测因素是他们学习的小时数、他们之前的表现以及他们是否处于恋爱关系。

由此产生的预测是:


其他值得研究的方面
正则化
有时我们的模型可能会过拟合数据。这是一件坏事,因为虽然它在分类训练集方面可能表现更好,但在对新数据进行预测时可能不太适用。正则化可以帮助我们阻止这种情况。
多类分类
将事物分为“阳性”和“阴性”之外的类别。这可以粗略地通过为每个类别创建一个分类器来完成,将你的输入通过所有分类器,然后选择得分最高的分类。
例如,对于三个类别:猫、狗和桌子,一张猫的图片在猫分类器上可能得分为 0.9,在狗分类器上得分为 0.4,在桌子分类器上得分为 0.001。然后我们选择得分最高的分类器(0.9 分)并返回“这是一只猫”。
来源
历史
- 2016 年 12 月 19 日:初始版本