
在 WPF 中创建图表
4.18/5 (10投票s)
本文介绍如何在 WPF 中创建图表。
引言
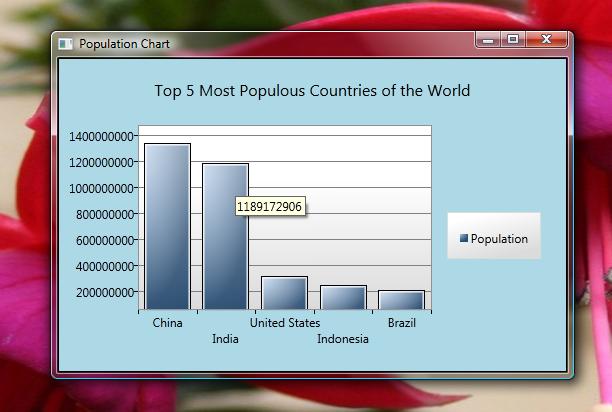
本文介绍如何在 WPF 中创建美观的图表。为了演示这一点,我使用 Visual C# 2010 Express Edition 开发了一个 WPF 项目。该项目使用柱状图显示世界上人口最多的前五个国家的人口。
背景
WPF 中的图表功能由 WPF Toolkit 程序集提供。项目中添加了对 *System.Windows.Controls.DataVisualization.Toolkit.dll* 文件的引用。然后,如下所示在页面中导入 `System.Windows.Controls.DataVisualization.Charting` 命名空间
xmlns:cht="clr-namespace:System.Windows.Controls.DataVisualization.Charting;
assembly=System.Windows.Controls.DataVisualization.Toolkit"
Using the Code
为了提供图表数据,创建了以下类
public class Country
{
    public Country(string Name, long Population)    // Constructor
    {
        this.Name = Name;
        this.Population = Population;
    }
    public string Name                // Name Property
    {
        get;
        set;
    }
    public long Population                // Population Property
    {
        get;
        set;
    }
}
以下类表示人口最多的前五个国家/地区的列表
public class CountryCollection :
Collection<Country> // Extending from System.Collections.ObjectModel.Collection class
{
    public CountryCollection() // Constructor to add Country objects to the CountryCollection
    {
        Add(new Country("China", 1336718015));
        Add(new Country("India", 1189172906));
        Add(new Country("United States", 313232044));
        Add(new Country("Indonesia", 245613043));
        Add(new Country("Brazil", 203429773));
    }
}
接下来,在 XAML 代码中创建名为 `CountryCollection` 的资源,如下所示
<Window.Resources>
    <local:CountryCollection x:Key="CountryCollection"/>
</Window.Resources>
以下是图表控件的 XAML 代码
<cht:Chart Name="populationChart" Title="Top 5 Most Populous Countries of the World"
    Background="LightBlue">
     <cht:Chart.Series>
         <cht:ColumnSeries Title="Population"
    ItemsSource="{StaticResource CountryCollection}"
    IndependentValueBinding="{Binding Path=Name}"
    DependentValueBinding="{Binding Path=Population}">
         </cht:ColumnSeries>
     </cht:Chart.Series>
</cht:Chart>
在上面的代码中,`CountryCollection` 资源使用
`ItemsSource` 属性绑定到 `ColumnSeries`。`IndependentValueBinding` 属性绑定国家名称,
`DependentValueBinding` 属性绑定人口。
以下是应用程序的完整 XAML 代码
<Window x:Class="WPFPopulationChart.MainWindow"
        xmlns="http://schemas.microsoft.com/winfx/2006/xaml/presentation"
        xmlns:x="http://schemas.microsoft.com/winfx/2006/xaml"
        xmlns:local="clr-namespace:WPFPopulationChart"
        xmlns:cht="clr-namespace:System.Windows.Controls.
        DataVisualization.Charting;assembly=System.Windows.Controls.DataVisualization.Toolkit"
        Title="Population Chart" Height="350" Width="525">
    <Window.Resources>
        <local:CountryCollection x:Key="CountryCollection"/>
    </Window.Resources>
    <Grid>
        <cht:Chart Name="populationChart"
        Title="Top 5 Most Populous Countries of the World" Background="LightBlue">
            <cht:Chart.Series>
                <cht:ColumnSeries Title="Population"
                ItemsSource="{StaticResource CountryCollection}"
                IndependentValueBinding="{Binding Path=Name}"
                DependentValueBinding="{Binding Path=Population}">
                </cht:ColumnSeries>
            </cht:Chart.Series>
        </cht:Chart>
    </Grid>
</Window>
关注点
图表的人口数据来自以下链接
人口数据截至 2011 年 12 月。