
C++ 内存泄漏查找器
4.96/5 (37投票s)
如何通过库注入编写内存泄漏检测程序
介绍
在本文中,我将讨论一种为 C 和 C++ 应用程序构建内存泄漏检测程序的方法。
这并不是要编写一个功能齐全的泄漏检测器,而是介绍一种(众多)查找泄漏的方法。
我采用的方法是 库注入,即使提供的 C++ 源代码是针对 Linux 的(在 Ubuntu 11.10 上测试过),该方法也应该适用于任何允许库注入的平台。
什么是泄漏
应用程序可以通过多种方式泄漏资源,并且有许多不同的资源可能被泄漏。 在本文中,我将重点关注内存泄漏(而不是文件句柄、套接字或其他可能被分配的资源),并且只查找内存泄漏,但即使将范围限制在内存,仍然有许多不同类型的泄漏。 在谈论 C++ 中的内存泄漏时,大多数人会想到类似这样的场景(一个非常简化的例子);
void foo()
{
  int* my_pointer = new int;
}   // my_pointer is never deleted, we've just leaked sizeof(int) bytes!
分配了内存,但在指向已分配内存的引用超出范围之前没有被删除/取消分配。当然,这意味着在程序终止之前,这些内存将无法使用,也无法用于进一步的分配。
但是内存泄漏也可能以其他更微妙的方式出现,有时内存仍然被引用但只是未被使用,例如当项目被定期添加到 std::vector 而从未被释放时。如果这样的 std::vector 从未被清空,并且应用程序再也没有查看过它,那么它就可以被认为是泄漏,尽管内存仍然被引用。
在本文中,为了简单起见,我将只关注第一种情况;已分配但未取消分配的内存。简而言之,我将展示一种跟踪对 malloc 和 free 的每次调用的方法,并记录信息以便将它们匹配起来。
您可能会争辩说您正在使用 C++,因此您使用 new 和 delete 来分配和取消分配内存,但在大多数情况下,它们的实现仍然会调用 C 版本 malloc 和 free。
库注入
库注入是指用户指示操作系统在查找“标准”库中的系统范围方法之前,先在 **LibraryA** 中查找,其中 **LibraryA** 是包含系统函数重载的库。在某些 Linux 和 Unix 发行版上,可以使用 **LD_PRELOAD** 环境变量来设置要注入的库以实现此目的。
要跟踪内存分配和取消分配,必须创建一个包含 malloc 和 free 重载的共享库,然后将其注入,以便每当请求内存分配时,都会首先命中自定义版本。
第一步是创建一个 C++ 文件,**leakfinder.cpp**,其中将包含两个方法;
#include<iostream>

void* malloc(size_t size)
{
  std::cout << "malloc called" << std::endl;
  // Somehow track this allocation
}

void free(void* ptr)
{
  std::cout << "free called" << std::endl;
  // Somehow marry up this deallocation to a previous allocation
}
可以通过运行 **g++**(这是本文中我将用于 C++ 代码的编译器)将上面的示例编译成共享库,运行方式如下:
~/SomeFolder$g++ -shared -fPIC leakfinder.cpp -o leakfinder.so -ldl
我们可以通过一个旨在泄漏的 C 程序示例来测试这一点,该 C 程序名为 **c_example**,其代码如下:
#include <stdlib.h>
#include <stdio.h>

void foo(int size)
{
  int* data = malloc(sizeof(int) * size);
  // Uncomment this to stop leak
  //free(data);
}

void bar(int size)
{
  char *data = malloc(sizeof(char) * size);
  foo(size);
  // Uncomment this to stop leak
  //free(data);
}

void foobar(int size)
{
  bar(size);
}

int main(void)
{
  printf("leakfinder C example app\n");
  printf("This application is expected to leak\n");

  foobar(8);
  foobar(16);

  printf("leakfinder C example app all done\n");
  return 0;
}
重要!
在一个与编译源代码的终端不同的终端中测试注入非常重要,否则注入可能会(也将)干扰编译器和任何使用 malloc 或 free 的其他命令。
因此,在使用此示例时,请确保打开一个终端用于编译和构建(包括泄漏查找器和示例应用程序),以及另一个设置了 **LD_PRELOAD** 环境变量的终端,您可以在其中运行测试应用程序。
另一种确保预加载仅适用于 **c_example** 应用程序的方法是像这样运行它; LD_PRELOAD=./leakfinder.so c_example.
在您的终端中设置 **LD_PRELOAD** 指向 **leakfinder.so**,并使用以下命令运行 **c_example** 测试应用程序;
~/SomeFolder$export LD_PRELOAD=./leakfinder.so
~/SomeFolder$./c_example
首次运行时,会发现没有检测到分配或取消分配,这是由于链接问题。由于使用了 **g++**(一个 **C++** 而非 **C** 编译器)来编译 **leakfinder.cpp** 文件,它应用了 名称修饰,这意味着函数名称与预期的系统函数 malloc 和 free 不匹配。要解决此问题,必须使用 **C** 链接来声明函数。
#include<iostream>

extern "C" void* malloc(size_t size)
{
  std::cout << "malloc called" << std::endl;
  // Somehow track this allocation
}

extern "C" void free(void* ptr)
{
  std::cout << "free called" << std::endl;
  // Somehow marry up this deallocation to a previous allocation
}
当具有正确链接的泄漏查找器被预加载并运行示例时,它将生成类似如下的输出;
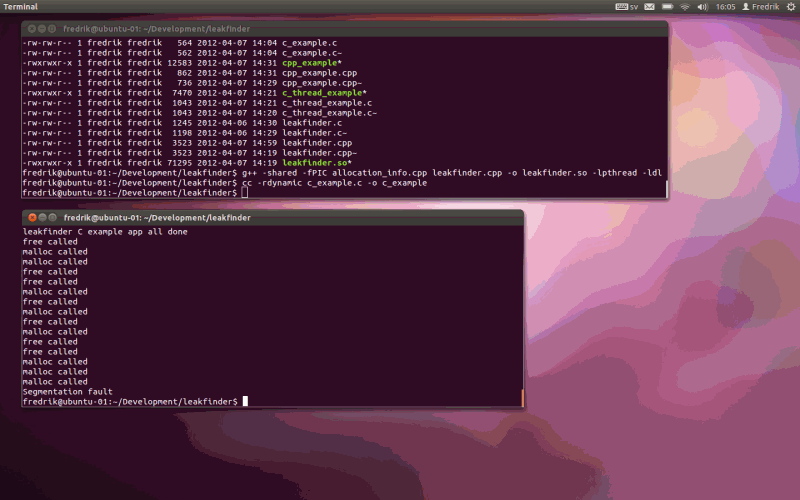
大量分配和取消分配被拦截!
这是因为即使测试应用程序仅显式分配了几项内容,其他部分(如 printf 甚至注入代码中的 cout 调用)也会分配和取消分配内容。
输出以段错误结尾,这当然是因为您不能期望用打印语句替换实际的内存分配并期望事情仍然正常工作  " />,但该方法已证明有效。
实际实现
由于重载的 malloc 和 free 方法仍然执行其预期工作(即在堆上分配和取消分配内存)对于 **leakfinder** 来说非常重要,因此注入的代码必须查找实际实现的指针,并在跟踪它们之前将调用委托给这些实现。
查找实现
通过调用 dlsym(在 **dlfcn.h** 中定义)可以找到实际实现。此函数返回使用 dlopen 提供的函数的函数指针。使用常量 RTLD_NEXT 可以检索上一个条目,并将该指针存储在 `static` 变量中以进行缓存,这样就不必每次都进行查找;
static void* (*sys_malloc)(size_t) = 0;
static void (*sys_free)(void*) = 0;

static void initialize_functions(void)
{
  sys_malloc = reinterpret_cast<void*(*)(size_t)>(dlsym(RTLD_NEXT, "malloc"));
  if (sys_malloc == 0)
    cerr << "leakfinder failed to read malloc function; " << dlerror() << endl;

  sys_free = reinterpret_cast<void(*)(void*)>(dlsym(RTLD_NEXT, "free"));
  if (sys_free == 0)
    cerr << "leakfinder failed to read free function; " << dlerror() << endl;
}

extern "C" void* malloc(size_t size)
{
  cout << "malloc called" << endl;
  if (sys_malloc == 0)
    initialize_functions();

  void* ptr = sys_malloc(size);

  return ptr;
}
extern "C" void free(void* ptr)
{
  cout << "free called" << endl;

  if (sys_free == 0)
    initialize_functions();

  sys_free(ptr);
}
在上面的代码中,使用 dlsym(RTLD_NEXT, [function name]) 查找 malloc 和 free 的系统版本(或*标准*版本),然后分别存储在 `sys_malloc` 和 `sys_free` 中。
在缓存了函数的系统版本(如果尚未缓存)后,将调用它们来执行分配或取消分配,然后泄漏查找器将拦截调用以跟踪编译泄漏列表所需的信息。
分配信息
为了让用户修复泄漏,每个泄漏都需要与附加信息相关联,以便于跟踪和纠正泄漏。在 **leakfinder** 中,我跟踪四种不同的内容;
- 参考文献
- 堆栈跟踪
- 大小
- 线程
参考文献
为了将取消分配与之前的分配匹配起来,需要在 malloc 和 free 调用之间存在一些唯一且一致的东西,一个可以使用的东西是已分配内存的地址。它必须是唯一的,因为不允许两个分配获得相同的内存块,并且它在调用之间是一致的,因为它是分配的返回值和取消分配的参数。
堆栈跟踪
要使内存泄漏检测器有用,它需要能够告诉用户泄漏是在哪里分配的。 在 Linux 中获取堆栈跟踪的一种方法是使用 **execinfo.h** 中的 backtrace 和 backtrace_symbols 函数。
backtrace 函数获取特定线程堆栈中所有当前活动函数的返回地址,这本质上就是堆栈跟踪。
为了获得更易读的堆栈跟踪版本,可以将 backtrace 的返回地址输入 backtrace_symbols 以获取堆栈上函数的名称。
  void* frames[max_frame_depth];
  size_t stack_size = backtrace(frames, max_frame_depth);
  char** stacktrace = backtrace_symbols(frames, stack_size);
大小和线程
记录分配的大小以及分配的线程,虽然不太重要但有时也很有用。
大小作为 size_t 参数传递给 malloc,因此很容易获取和记录。
记录当前线程 ID 可能比使用的线程库稍微难一些。在此示例中,我使用了 **pthread** 库,因此通过调用 pthread_self() 获取 pthread_t 类型的线程 ID。
allocation_info
上面列出的信息,包括引用、堆栈跟踪、大小和线程,在 **leakfinder** 中存储在一个名为 `allocation_info` 的类中。
allocation_info.hpp
#ifndef __allocation_info
#define __allocation_info

#include <vector>
#include <string>

#include <pthread.h>

namespace bornander
{
  namespace memory
  {
    class allocation_info
    {
    public:
      typedef long long address_type;

    private:
      allocation_info::address_type address;
      size_t size;
      std::vector<std::string> stacktrace;
      pthread_t thread_id;

    public:
      allocation_info(void* address, size_t size, char** stacktrace, size_t depth, pthread_t thread_id);

      allocation_info::address_type get_address() const;
      size_t get_size() const;
      std::vector<std::string> get_stacktrace() const;
      pthread_t get_thread_id() const;
    };
  }
}

#endif
allocation_info.cpp
#include "allocation_info.hpp"

namespace bornander
{
  namespace memory
  {
    allocation_info::allocation_info(void* address, size_t size, char** stacktrace, size_t depth, pthread_t thread_id)
    {
      this->address = reinterpret_cast<allocation_info::address_type>(address);
      this->size = size;
      this->thread_id = thread_id;

      // Skip first frame as that is the overriden malloc method
      for(int i = 1; i < depth; ++i)
      {
        std::string frame = stacktrace[i];
        this->stacktrace.push_back(frame);
      }
    }

    allocation_info::address_type allocation_info::get_address() const
    {
      return address;
    }

    size_t allocation_info::get_size() const
    {
      return size;
    }

    std::vector<std::string> allocation_info::get_stacktrace() const
    {
      return stacktrace;
    }

    pthread_t allocation_info::get_thread_id() const
    {
      return thread_id;
    }
  }
}
跟踪泄漏
拥有了拦截分配(库注入)和存储分配信息(allocation_info)的方法后,我们现在就可以实现基本的内存泄漏检测器了。
分配
在分配方法内部跟踪分配的第一个问题是,要跟踪它,需要分配内存来存储 allocation_info,这显然意味着每次分配都需要额外的分配。由于额外的分配也使用 malloc,因此该方法会导致堆栈溢出。
解决方案是只跟踪来自 **leakfinder** 外部的分配。通过声明一个名为 `isExternalSource` 的 `static` 布尔变量,在记录分配之前将其设置为 `false`,并在完成后将其设置回 `true`,就可以排除由记录源分配引起的分配。重载的 malloc 方法看起来像这样;
static bool isExternalSource = true;
static void* (*sys_malloc)(size_t) = 0;

extern "C" void* malloc(size_t size)
{
  // Make sure we're initialized
  if (sys_malloc == 0)
    initialize_functions();
// Call the actual malloc and keep the result void* ptr = sys_malloc(size);
if (isExternalSource)
{
isExternalSource = false;
// Record the details of this allocation in an allocation_info
isExternalSource = true;
}
return ptr;
}
这解决了内部分配的排除问题,但存在线程问题,因为 `static` `isExternalSource` 可能会被两个线程同时读/写,从而导致未定义的行为。
通过用锁(使用 **pthread** 线程)保护 if 语句内部,malloc 方法变为;
static pthread_mutex_t cs_mutex = PTHREAD_MUTEX_INITIALIZER;

static bool isExternalSource = true;
static void* (*sys_malloc)(size_t) = 0;

extern "C" void* malloc(size_t size)
{
  // Make sure we're initialized
  if (sys_malloc == 0)
    initialize_functions();

  // Call the actual malloc and keep the result
  void* ptr = sys_malloc(size);

  if (isExternalSource)
  {
    pthread_t thread_id = pthread_self();
    pthread_mutex_lock(&cs_mutex);
    isExternalSource = false;

    // Record the allocation here
    isExternalSource = true;
    pthread_mutex_unlock(&cs_mutex);
  }

  return ptr;
}
现在 malloc 实现是线程安全的(或基本线程安全,它仍然存在一些问题,但为了简单起见,本文将保持这种状态)。
其余的实现工作是获取堆栈跟踪并将其与引用、大小和线程 ID 一起存储。大小已经作为参数传入,并且线程 ID 已通过 pthread_self 获取,剩余需要存储的是引用,即实际 malloc 实现返回的 `ptr` 的地址。
以上所有内容都产生了如下所示的 malloc 函数;
static pthread_mutex_t cs_mutex = PTHREAD_MUTEX_INITIALIZER;

static size_t allocation_count = 0;
static vector<allocation_info> allocations;

static const size_t max_frame_depth = 128;
static bool isExternalSource = true;
static void* (*sys_malloc)(size_t) = 0;

extern "C" void* malloc(size_t size)
{
  if (sys_malloc == 0)
    initialize_functions();

  void* ptr = sys_malloc(size);

  if (isExternalSource)
  {
    pthread_t thread_id = pthread_self();
    pthread_mutex_lock(&cs_mutex);
    isExternalSource = false;

    // Used for summary statistics
    ++allocation_count;

    // Grab stacktrace
    void* frames[max_frame_depth];
    size_t stack_size = backtrace(frames, max_frame_depth);
    char** stacktrace = backtrace_symbols(frames, stack_size);
    allocation_info allocation(ptr, size, stacktrace, stack_size, thread_id);

    allocations.push_back(allocation);

    // Make sure to release the memory allocated by backtrace_symbols
    sys_free(stacktrace);
isExternalSource = true;
pthread_mutex_unlock(&cs_mutex);
}
return ptr;
}
取消分配
将取消分配与之前的分配匹配很简单。`free` 使用相同的方法来防止其因内部释放和线程安全而运行,并且此外,它只是在 `allocations` vector 中查找 `allocation_info`。唯一键是引用或地址;
extern "C" void free(void* ptr)
{
  if (sys_free == 0)
    initialize_functions();

  allocation_info::address_type address = reinterpret_cast<allocation_info::address_type>(ptr);
  sys_free(ptr);

  if (isExternalSource)
  {
    pthread_mutex_lock(&cs_mutex);
    isExternalSource = false;
    for (int i = 0; i < allocations.size(); ++i)
    {
      allocation_info allocation = allocations[i];
      if (allocation.get_address() == address)
      {
        allocations.erase(allocations.begin() + i);
        break;
      }
    }
    isExternalSource = true;
    pthread_mutex_unlock(&cs_mutex);
  }
}
总结
在跟踪和匹配了所有分配和取消分配之后,那些从未被取消分配的必须被报告,那么什么时候是报告的合适时机呢?
由于在程序终止之前几乎无法技术上确定是否发生了泄漏,因此 **leakfinder** 使用程序退出时间来汇总泄漏。有人可能会争辩说,当引用内存的指针超出范围但未被取消分配时,泄漏就发生了,但由于指针值可以存储在几乎任何其他数据结构中,因此很难依赖这一点。
C 风格的析构函数
有不同的方法可以挂接到程序终止。选择哪种方法取决于平台和个人喜好。
一种方法是使用 `pragma` 指令;
#pragma fini (some_exit_handler)
但对于 **leakfinder**,我采用了 C 风格的析构函数;
static void compile_allocation() __attribute__((destructor));
使用此方法,当共享库被卸载时(通常在程序退出时),`compile_allocation` 方法将被执行。
由于程序退出时所有未取消分配的分配都存储在 `allocations` 向量中,因此 `compile_allocation` 方法的工作就是遍历泄漏并以某种方式输出泄漏信息。
我不确定输出泄漏信息的最佳位置。在某些情况下,文件可能很方便,但为了简单起见,我决定让 **leakfinder** 直接将摘要转储到标准输出。
为了避免额外的麻烦,`isExternalSource` 在 `compile_allocaion` 的开头需要设置为 `false`,因为打印摘要需要发生分配。
为了以十六进制格式打印地址和指针,使用了 **iomanip** 中的 `hex` 和 `dec`。
void compile_allocation()
{
  isExternalSource = false;
  if (allocations.empty())
  {
    cout << "leakfinder found no leaks, not one of the " << allocation_count;
    cout << " allocations was not released." << endl;
  }
  else
  {
    cout << "leakfinder detected that " << allocations.size();
    cout << " out of " << allocation_count << " allocations was not released." << endl;
    for (int i = 0; i < allocations.size(); ++i)
    {
      allocation_info allocation = allocations[i];
      cout << "Leak " << (i+1) << "@0x" << hex << allocation.get_thread_id() << dec;
      cout << "; leaked " << allocation.get_size() << " bytes at position 0x";
      cout << hex << allocation.get_address() << dec << endl;

      vector<string> stacktrace = allocation.get_stacktrace();
      for (int j = 0; j < stacktrace.size(); ++j)
      {
        cout << "\t" << stacktrace[j] << endl;
      }
    }
  }
}
试用
要进行尝试,首先通过键入以下命令构建 **leakfinder** 共享库(对于那些不关心手动编译的人,也包含了一个 *makefile*);
g++ -shared -fPIC allocation_info.cpp leakfinder.cpp -o leakfinder.so -lpthread -ldl
然后通过键入以下命令构建 **c_example** 共享库;
cc c_example.c -o c_example
然后,打开另一个终端并设置 **LD_PRELOAD**;
export LD_PRELOAD=./leakfinder.so
最后,在设置了 **LD_PRELOAD** 的终端中运行 **c_example**;
./c_example
运行该应用程序应该会产生类似如下的输出;
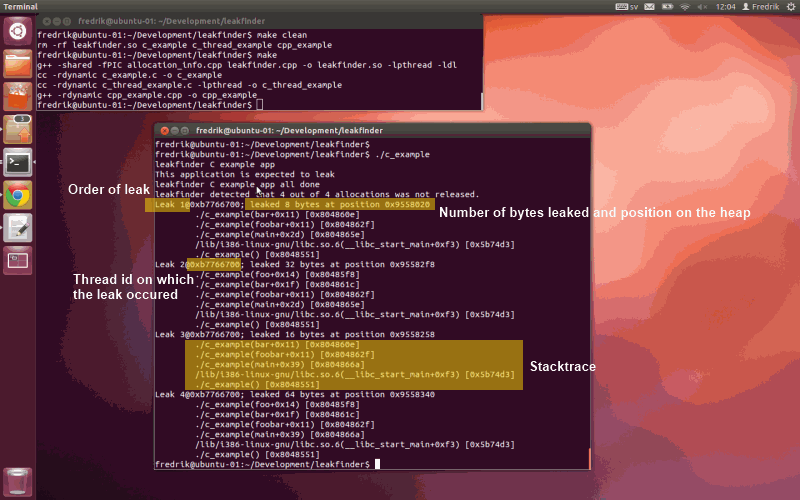
  fredrik@ubuntu-01:~/Development/leakfinder$ ./c_example
  leakfinder C example app
  This application is expected to leak
  leakfinder C example app all done
  leakfinder detected that 4 out of 4 allocations was not released.
  Leak 1@0xb77876d0; leaked 8 bytes at position 0x8e63020
    ./c_example() [0x804843e]
    ./c_example() [0x804845f]
    ./c_example() [0x804848e]
    /lib/i386-linux-gnu/libc.so.6(__libc_start_main+0xf3) [0xaef113]
    ./c_example() [0x8048381]
  Leak 2@0xb77876d0; leaked 32 bytes at position 0x8e632d0
    ./c_example() [0x8048428]
    ./c_example() [0x804844c]
    ./c_example() [0x804845f]
    ./c_example() [0x804848e]
    /lib/i386-linux-gnu/libc.so.6(__libc_start_main+0xf3) [0xaef113]
    ./c_example() [0x8048381]
  Leak 3@0xb77876d0; leaked 16 bytes at position 0x8e63230
    ./c_example() [0x804843e]
    ./c_example() [0x804845f]
    ./c_example() [0x804849a]
    /lib/i386-linux-gnu/libc.so.6(__libc_start_main+0xf3) [0xaef113]
    ./c_example() [0x8048381]
  Leak 4@0xb77876d0; leaked 64 bytes at position 0x8e63318
    ./c_example() [0x8048428]
    ./c_example() [0x804844c]
    ./c_example() [0x804845f]
    ./c_example() [0x804849a]
    /lib/i386-linux-gnu/libc.so.6(__libc_start_main+0xf3) [0xaef113]
    ./c_example() [0x8048381]
  fredrik@ubuntu-01:~/Development/leakfinder$
虽然这确实首先打印了 **c_example** 的输出,然后是四个泄漏的摘要,但堆栈跟踪并不容易解析。这是因为程序缺少符号,但通过再次编译它(在第一个终端中)并使用 **-rdynamic** 选项,可以纠正这一点;
cc -rdynamic c_example.c -o c_example
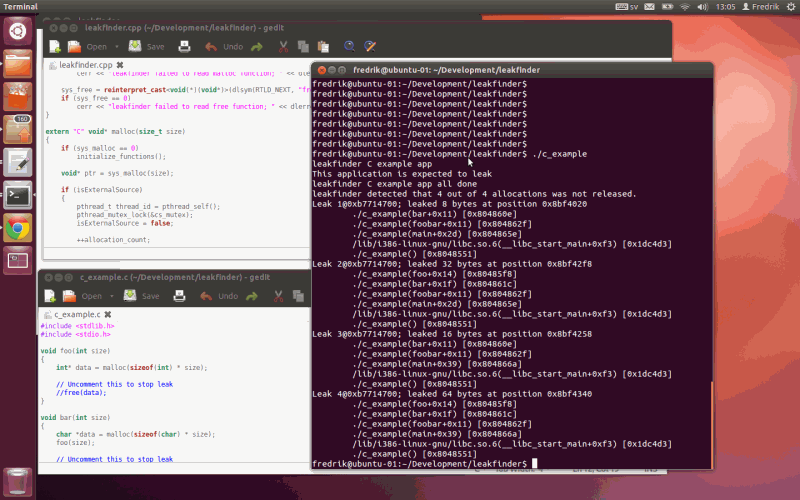
提供了更有用的堆栈跟踪;
  fredrik@ubuntu-01:~/Development/leakfinder$ ./c_example
  leakfinder C example app
  This application is expected to leak
  leakfinder C example app all done
  leakfinder detected that 4 out of 4 allocations was not released.
  Leak 1@0xb76fb6d0; leaked 8 bytes at position 0x91d9020
    ./c_example(bar+0x11) [0x804860e]
    ./c_example(foobar+0x11) [0x804862f]
    ./c_example(main+0x2d) [0x804865e]
    /lib/i386-linux-gnu/libc.so.6(__libc_start_main+0xf3) [0x144113]
    ./c_example() [0x8048551]
  Leak 2@0xb76fb6d0; leaked 32 bytes at position 0x91d92f8
    ./c_example(foo+0x14) [0x80485f8]
    ./c_example(bar+0x1f) [0x804861c]
    ./c_example(foobar+0x11) [0x804862f]
    ./c_example(main+0x2d) [0x804865e]
    /lib/i386-linux-gnu/libc.so.6(__libc_start_main+0xf3) [0x144113]
    ./c_example() [0x8048551]
  Leak 3@0xb76fb6d0; leaked 16 bytes at position 0x91d9258
    ./c_example(bar+0x11) [0x804860e]
    ./c_example(foobar+0x11) [0x804862f]
    ./c_example(main+0x39) [0x804866a]
    /lib/i386-linux-gnu/libc.so.6(__libc_start_main+0xf3) [0x144113]
   ./c_example() [0x8048551]
  Leak 4@0xb76fb6d0; leaked 64 bytes at position 0x91d9340
    ./c_example(foo+0x14) [0x80485f8]
    ./c_example(bar+0x1f) [0x804861c]
    ./c_example(foobar+0x11) [0x804862f]
    ./c_example(main+0x39) [0x804866a]
    /lib/i386-linux-gnu/libc.so.6(__libc_start_main+0xf3) [0x144113]
    ./c_example() [0x8048551]
  fredrik@ubuntu-01:~/Development/leakfinder$
现在包含了方法名称,这使得读取更加容易。虽然这对于 **C++** 程序也有效,但由于名称修饰,它们的堆栈跟踪仍然有些混乱,但当使用 **-rdynamic** 编译时,仍然非常易于阅读,如下面的 **cpp_example**(也包含在下载中)的输出所示;
  fredrik@ubuntu-01:~/Development/leakfinder$ ./cpp_example
  leakfinder C++ thread example app
  This application is expected to leak
  leakfinder detected that 4 out of 5 allocations was not released.
  Leak 1@0xb77e66d0; leaked 4 bytes at position 0x8e79020
    /usr/lib/i386-linux-gnu/libstdc++.so.6(_Znwj+0x27) [0x2f19d7]
    ./cpp_example(_ZN10my_class_aC1Ev+0x12) [0x8048c64]
    ./cpp_example(_ZN10my_class_bC1Ev+0x11) [0x8048ce9]
    ./cpp_example(main+0x5f) [0x8048b97]
    /lib/i386-linux-gnu/libc.so.6(__libc_start_main+0xf3) [0x346113]
    ./cpp_example() [0x8048a81]
  Leak 2@0xb77e66d0; leaked 4 bytes at position 0x8e79108
    /usr/lib/i386-linux-gnu/libstdc++.so.6(_Znwj+0x27) [0x2f19d7]
    ./cpp_example(_ZN10my_class_b3fooEv+0x12) [0x8048caa]
    ./cpp_example(_ZN10my_class_b3barEv+0x11) [0x8048cc1]
    ./cpp_example(_ZN10my_class_b6foobarEv+0x11) [0x8048cd5]
    ./cpp_example(main+0x6b) [0x8048ba3]
    /lib/i386-linux-gnu/libc.so.6(__libc_start_main+0xf3) [0x346113]
    ./cpp_example() [0x8048a81]
  Leak 3@0xb77e66d0; leaked 4 bytes at position 0x8e791f0
    /usr/lib/i386-linux-gnu/libstdc++.so.6(_Znwj+0x27) [0x2f19d7]
    ./cpp_example(_ZN10my_class_b3fooEv+0x12) [0x8048caa]
    ./cpp_example(main+0x77) [0x8048baf]
    /lib/i386-linux-gnu/libc.so.6(__libc_start_main+0xf3) [0x346113]
    ./cpp_example() [0x8048a81]
  Leak 4@0xb77e66d0; leaked 1 bytes at position 0x8e79250
    /usr/lib/i386-linux-gnu/libstdc++.so.6(_Znwj+0x27) [0x2f19d7]
    ./cpp_example(_Z12cpp_functionv+0x12) [0x8048b26]
    ./cpp_example(c_function+0xb) [0x8048b36]
    ./cpp_example(main+0x7c) [0x8048bb4]
    /lib/i386-linux-gnu/libc.so.6(__libc_start_main+0xf3) [0x346113]
    ./cpp_example() [0x8048a81]
  fredrik@ubuntu-01:~/Development/leakfinder$
关注点
正如我在文章开头提到的,这并不是一个完整的泄漏检测产品的尝试,而是对其创建方式的解释。细心的读者会意识到本文包含的实现有很多不足之处,例如它没有明确处理 calloc,并且使用 `std::vector` 来存储 allocation_info 对象会导致查找性能线性下降。
尽管如此,我希望本文能提供一些关于如何以非侵入性方式(在本意上,应用程序代码无需进行插装或以其他方式增强)发现泄漏的见解。
而且奇怪的是,Code Project 文章提交向导不允许我上传 .tar 文件,所以如果您想要 .tar 文件的话;您可以从这里获取(allocation_info.cpp 文件已损坏,但我稍后会修复它,.zip 文件是正确的); https://sites.google.com/site/fredrikbornander/Home/leakfinder.tar?attredirects=0&d=1
欢迎提出任何评论。
历史
2012-05-29;第一个版本。
2012-06-06;第二个版本,修复了格式,添加了 mossaiby 的建议,并修复了 .zip 文件中损坏的 cpp 文件,正如 ian4264 指出的那样。