
无 WPF 的 GDI+.NET 报告组件:星形报告
5.00/5 (14投票s)
StarReport:无 WPF 的 GDI+.NET 报告组件。
引言
我们正带着明亮的眼睛,敏锐地关注着下一波技术,迈向未来。我们已经抛弃了昨天的技术,将其弃之不用,去追逐新的、“更好”的捕鼠器。本文的目的是,在短暂的片刻,回顾一下我们旧的、并且在很大程度上已被遗忘的技术。这些技术仍然发挥着作用,无论我们被告知它多么微不足道。
背景
在当今的技术领域,如果我们要为 UI 构建一个报告生成器,大多数 .NET 开发人员首先会想到的技术是 WPF。为了与本文的主题保持一致,我将使用 GDI+ 和 WinForms 来构建此组件。没错。我将演示一个看似过时的 UI 技术如何也能很好地完成工作。不仅如此,我的解决方案还将快速高效,并拥有任何可比 .NET 报告组件的所有功能。
我将把这个报告组件称为“星形报告”。
以下是 UI 报告生成器组件的要求:
- 支持多种报告类型(通用列表、卡片列表、层次结构、自由格式、多表)
- 支持分页
- 自定义筛选器,多个筛选器
- 自定义排序描述符
- 显示
- 页码
- 日期
- 可选页眉:公司名称、地址、联系方式
- 自动网格线
- 支持可自定义缩进
- 支持日期
- 摘要
- 嵌套摘要、分组摘要
- 支持 Sum()、Avg()、Min()、Max()、Count() 函数
- 支持摘要字体和画笔
- 总计列
- 总摘要单元格
- 下钻架构
- 可自定义单元格
- 支持图片
- 支持对齐方式
- 支持不同格式
- 换行、不换行、适应黑盒、不裁剪、垂直方向、行限制
- 可自定义行
- 交替颜色
- 支持空值和空值数据
- 支持多种字体
- 支持查找表
- 完整的打印预览支持
- 可配置的图形单位(像素、磅、英寸、文档、毫米)
- 与
DataTable交互 - 完全通过代码配置
- 在 Visual Studio 中提供一流的支持。这意味着我可以使用自定义类型描述符,仅使用 Visual Studio 2012 IDE 即可配置整个报告!
- 可序列化:能够序列化其所有设置
- 直观的用户界面
- 高质量图片,具有高质量插值模式
- 抗锯齿网格适配技术
很棒,对吧?
实施前决策
构建 StarReport 的算法出奇地简单
- 绘制页眉
- 绘制公司信息
- 绘制报告名称
- 绘制公司名称
- 绘制公司地址
- 绘制日期(可选)
- 绘制页码(可选)
- 绘制记录
- 绘制列
- 绘制行
- 绘制摘要(可选)
- 绘制页脚(可选)
- 报告的每一页重复以上步骤
- 在最后一页绘制总摘要(可选)
考虑到这些步骤,首先应该想到的问题是
- 从哪里获取数据来生成报告?
- 在哪里打印数据?在哪个表面或控件上?
让我们回答第一个问题。
我决定使用 .NET 中最普遍的数据控件,即 DataTable。每个开发人员都熟悉这个对象,并且它在 .NET 中得到了极大的支持。许多其他 .NET 库都返回 DataTable 对象作为数据容器。我觉得它将是向 StarReport 传递数据的最简单工具。它还具有其他我可以使用有用的属性。例如:
- 我可以使用伪 SQL 语法筛选
DataTable,我可以动态生成该语法。 - 我可以轻松遍历其列和行。我可以使用其列和行索引器相对快速地访问列和行
- 我可以在记录上创建一个默认视图,修改它,并且仍然拥有原始记录
所以,我选择了 DataTable 来获取数据到 StarReport。
现在我们来回答第二个问题(在哪里打印数据?在哪个表面或控件上?)
我们需要一个绘图表面来绘制我们的报告。GDI+(图形设备接口)的核心是 Graphics 对象。我们使用此对象来绘制报告项,即文本、单元格、行、图像、形状、网格等等。我本可以使用 Windows 窗体的设备上下文作为绘图表面,但我认为这有点笨拙。我希望能够高度自定义我的绘图表面并拥有以下功能
- 能够设置高质量平滑模式
- 能够设置高质量插值模式
- 设置 UI 报告组件“内部”报告的宽度和高度
- 将来能够轻松添加其他功能。例如,保存报告的图片。
我决定使用 Bitmap 对象作为我的绘图表面。我也会从同一个 Bitmap 中获取我需要的 Graphics 对象。Bitmap 对象提供了我上面提到的所有功能以及更多。但是,我们不能为报告的每一页都创建一个 Bitmap,因为内存成本会太高。因此,我缓存了我的位图,并且只显示当前可见的页面。当然,要实现这一点,必须存储状态信息。
好的!我们已经有了两个主要的东西,一个 DataTable 来获取数据,一个绘图表面来绘制实际的报告。
绘制报告的第一页
为了绘制报告的第一页,我们首先需要数据。正如我们讨论的那样,它来自 DataTable。我假设 DataTable 包含列和行,这些列和行在调用 StarReport 的 GenerateReport 方法之前已预先填充。为了设置我们的报告,我们创建相应的 ColumnCell 和 RowCellInfo 对象以匹配数据表的行和列。这些对象包含在屏幕上绘制数据所需的所有信息。
首先设置报告的标题信息:
StarReport sr = new StarReport();
sr.Report.Settings.ReportType = ReportType.GeneralList;
sr.Report.Settings.Header.ReportTitle = "Patient Master List";
sr.Report.Settings.OutlineTable = true;
sr.Report.Settings.PrintTableGrid = true;
sr.Report.Settings.PrintTotalRecords = true;
sr.Report.Settings.TotalText = "Total Records";

sr.PageSettings.Landscape = true;
sr.Report.Settings.PrintPageNumbers = true;
sr.Report.Settings.PrintRowSeparator = true;
sr.Report.Settings.ReportDate = PrintReportDateLocation.LeftTop;
sr.Report.Settings.PrintHeading = PrintHeading.OnAllPages;
sr.Report.Settings.ColorAlternateRows = true;
OutlineTable 和 PrintTableGrid 属性允许我们自动为报告绘制网格(类似于 Excel)。无需处理“线条”对象并花费数小时来正确放置它们。这曾经让我对 Crystal Reports 非常恼火。另请注意,报告类型设置为 GeneralList。这意味着这是一个基本的报告,具有类似于 Excel 的列和行。在文章后面,我将展示如何创建带有分组和总计的层次结构报告。
现在,我们为报告中将显示的每一列创建一个 ColumnCell 和相应的 RowCellInfo 对象。
ColumnCell name = new ColumnCell("Name", 200);
RowCellInfo nameInfo = new RowCellInfo("Name", 200);
nameInfo.RowCell.CellFormat.FormatFlags = StringFormatFlags.NoClip;
nameInfo.RowCell.CellFormat.Alignment = Alignment.Far;
nameInfo.RowCell.Font = new Font(nameInfo.RowCell.Font, FontStyle.Bold);
name.RowCellInfoCollection.Add(nameInfo);
报告的第一列将显示为“名称”。此列的行单元格将从基础数据表的“名称”列获取其数据。从上面的代码示例中可以看到,我也可以设置其他属性。例如,格式、字体等等。如果我愿意,甚至可以在行单元格中添加图像。
我们沿着这条路径继续,并向报告添加另一列,即 图表编号。请注意,它映射到基础数据表中的 ID 列。
ColumnCell id = new ColumnCell("Chart No.", 70);
RowCellInfo idInfo = new RowCellInfo("ID", 70);
idInfo.RowCell.DataType = DataType.Int32;
idInfo.RowCell.FormatString = "D8"
假设这些是报告所需的仅有的两列。下一步是在 Graphics 对象的表面上生成报告并将其显示在屏幕上。
sr.GenerateReport(table, PrintPageDisplay.PREVIEW);
“table”是包含报告实际数据的数据表。就是这样!现在我们有了一个功能齐全的 UI 报告组件。我们现在可以打印、打印预览、排序和筛选报告。
在内部,我使用从 Bitmap 创建的 Graphics 对象来绘制列。
private void PrintColumns(ColumnCellCollection columns, int position,
  ref int yPos, ref Rectangle rect, SolidBrush myBrush, Pen linePen, PrintPageEventArgs e)
{
    foreach (ColumnCell column in columns)
    {
      column.Height = report.Settings.HeaderFont.Height;
      DrawColumn(column, position, yPos, ref rect, myBrush, linePen, e);
      position += column.Width;
    }
}

private void PrintColumns(SolidBrush myBrush, Pen linePen, Rectangle rect, float yPos, PrintPageEventArgs e)
{
    //Draw Columns from left margins
    int x = e.MarginBounds.Left;
    foreach (ColumnCell columnCell in this.report.Data.ColumnCellCollection)
    {
        //Draw the column
        columnCell.Height = report.Settings.HeaderFont.Height;
        DrawColumn(columnCell, x, (int)yPos, ref rect, myBrush, linePen, e);

        x += columnCell.Width;
     }
}

private void DrawColumn(ColumnCell columnCell, int x, int y,
  ref Rectangle rect, SolidBrush brush, Pen linePen, PrintPageEventArgs e)
{
  //Check if to draw this column all the way to the end margin
   if (columnCell.ExtendToMargin)
   {
      columnCell.Width = e.MarginBounds.Right - x;
      rect.Width = e.MarginBounds.Right - x;
   }
   else
     rect.Width = columnCell.Width;

   rect.Height = columnCell.Height;
   rect.X = x;
   rect.Y = y;

   //Draw column background
   brush.Color = columnCell.BackgroundColor;
   if (columnCell.BackgroundColor != Color.White)
       e.Graphics.FillRectangle(brush, rect);


   //Print a separator line at the end of the column
   if (columnCell.PrintSeparator)
        e.Graphics.DrawRectangle(Pens.Black, rect.X, rect.Y, rect.Width, rect.Height);

   //Align the text in the columns
   defaultStringFormat.Alignment = (StringAlignment)((int)columnCell.CellFormat.Alignment);
   defaultStringFormat.LineAlignment = (StringAlignment)((int)columnCell.CellFormat.LineAlignment);
   defaultStringFormat.FormatFlags = (StringFormatFlags)((int)columnCell.CellFormat.FormatFlags);
   defaultStringFormat.Trimming = (StringTrimming)((int)columnCell.CellFormat.Trimming);

   brush.Color = columnCell.ForeColor;
   //Draw the column
   e.Graphics.DrawString(" " + columnCell.Text,
      columnCell.Font, brush, rect, defaultStringFormat);

   if (columnCell.OutlineColumn)
   {
       linePen.Color = report.Settings.RowSeparatorLine.Color;
       e.Graphics.DrawRectangle(linePen, rect);
   }
}
我们使用类似的过程绘制报告的每个单元格
private void DrawCell(RowCell cell, int x, int y, ref Rectangle rect, SolidBrush brush, Graphics g)
{

   //Make sure that there is a value to print
   if (cell.Text.Trim() == String.Empty && cell.DontPrintIfBlank) return;

    if (cell.Width == 0) return;

    if (cell.ExtendToMargin)
        rect.Width = marginBounds_Right - x;
    else
        rect.Width = cell.Width;

    rect.Height = report.Settings.HeaderFont.Height;
    rect.X = x;
    rect.Y = y;


    brush.Color = cell.BackgroundColor;

    if (cell.BackgroundColor != Color.White)
    {
        g.FillRectangle(brush, rect);
    }

    brush.Color = cell.ForeColor;

   //Format the cell data
    defaultStringFormat.Alignment = (StringAlignment)((int)cell.CellFormat.Alignment);
    defaultStringFormat.LineAlignment = (StringAlignment)((int)cell.CellFormat.LineAlignment);
    defaultStringFormat.FormatFlags = cell.CellFormat.FormatFlags;
    defaultStringFormat.Trimming = (StringTrimming)((int)cell.CellFormat.Trimming);

    if (cell.FormatString != String.Empty && cell.Text != report.Settings.NullValue)
    {
        string formattedString = String.Empty;
        switch (cell.DataType)
        {
            case DataType.Int32:
               formattedString = String.Format("{0:" +
                 cell.FormatString.Trim() + "}", Int32.Parse(cell.Text));
               break;
            case DataType.Double:
                formattedString = String.Format("{0:" +
                  cell.FormatString.Trim() + "}", Double.Parse(cell.Text));
               break;

             case DataType.DateTime:
                 formattedString = String.Format("{0:" +
                   cell.FormatString.Trim() + "}", DateTime.Parse(cell.Text));
               break;

              case DataType.String:
                 formattedString = String.Format("{0:" +
                   cell.FormatString.Trim() + "}", cell.Text);
                 break;
              }

              cell.Text = formattedString;
    }

    if (cell.Image != null)
    {
        g.DrawImage(cell.Image, rect.X, rect.Y, cell.Image.Width, cell.Image.Height);

    }

    if (cell.LeftPadding > 0)
    {
        cell.Text = PadText(cell.Text.Trim(), cell.PaddingCharacter, cell.LeftPadding);
    }

    if (cell.Outline)
        g.DrawRectangle(Pens.Black, rect);

    g.DrawString(" " + cell.Text, cell.Font, brush, rect, defaultStringFormat);
}
从上述程序中我们可以得出,为了将报告正确绘制到 Graphics 对象,需要考虑很多因素。例如
- 可用的屏幕尺寸
- 从哪个坐标开始绘制
- 一页能容纳多少条记录
- 每列和每行字体的实际宽度和高度。不正确地测量字体可能会对您的报告造成严重破坏!
其中一些注意事项以及上面提到的报告绘制算法在以下过程中进行了概述
private int Print(DataTable table, int recordIndex)
{
    //Set up our margins
    int pageSize_Width = 816;
    int pageSize_Height = 1056;

    if (PageSettings.Landscape)
    {
        pageSize_Width = 1056;
        pageSize_Height = 816;
        marginBounds_Left = 48;
        marginBounds_Width = 960;
        marginBounds_Right = 1008;
        marginBounds_Top = 48;
        marginBounds_Bottom = 768;
        marginBounds_Height = 720;
        marginBounds_X = 48;
        marginBounds_Y = 48;
        pageBounds_Width = 1056;
        pageBounds_Height = 816;
        leftMargin = 48;
    }
    else
    {
        pageSize_Width = 1056;
        pageSize_Height = 816;
    }

    //Create our Graphics object
    Bitmap image = new Bitmap(pageSize_Width, pageSize_Height);
    Graphics g = Graphics.FromImage(image);

    //Make our report look good
    g.SmoothingMode = SmoothingMode.HighQuality;
    g.InterpolationMode = InterpolationMode.HighQualityBilinear;
    g.TextRenderingHint = TextRenderingHint.AntiAliasGridFit;

    int yPos = 0;// e.MarginBounds.Top;  //Top margin position to start printing

    int numLines = marginBounds_Height / report.Settings.HeaderFont.Height;

    numLines--;

    Debug.WriteLine("Number of Lines:" + numLines.ToString());
    Debug.WriteLine("Top Margins:" + yPos.ToString());
    Debug.WriteLine("Font Height:" + report.Settings.HeaderFont.Height);

    //Print report report.Settings.Header on first page of report
    if (recordIndex == 0 && report.Settings.PrintHeading == PrintHeading.OnFirstPage)
    {
        PrintHeader2(ref yPos, ref numLines, g);
    }
    else if (report.Settings.PrintHeading == PrintHeading.OnAllPages)
    {
        //Print report report.Settings.Header on all pages of report
        PrintHeader2(ref yPos, ref numLines, g);
    }

    //If this is a free form report then PrintFreeForm
    if (report.Settings.ReportType == ReportType.FreeForm)
    {
        return PrintFreeForm2(table, numLines, recordIndex, yPos, g);
    }

    //No records to print
    if (table != null && table.DefaultView.Count == 0)
    {
        g.DrawString("NO RECORDS", new Font(report.Settings.SubscriptFont,
                    FontStyle.Bold), myBrush, leftMargin, yPos);
        hasMorePages = false;

        PictureBox dd = new PictureBox();
        dd.Size = new Size(pageSize_Width, pageSize_Height);
        dd.Image = image;
        display.PageImages.Add(dd);

        return 0;

    }

    Debug.WriteLine("Number of Lines:" + numLines.ToString());
    Debug.WriteLine("Top Margins:" + yPos.ToString());

    //Print date on report
    if (report.Settings.ReportDate != PrintReportDateLocation.None)
    {
        PrintDate2(this.report.Settings.ReportDate, g);
        if (report.Settings.ReportDate == PrintReportDateLocation.LeftTop ||
            report.Settings.ReportDate == PrintReportDateLocation.RightTop)

            SkipLine(ref yPos, ref numLines);
    }

    //Print the total amount of records in this table
    if (report.Settings.PrintTotalRecords)
    {
        SizeF size = g.MeasureString(report.Settings.TotalText + ":" +
          table.Rows.Count.ToString(), report.Settings.SubHeaderFont);
        g.DrawString(report.Settings.TotalText + ":" + table.Rows.Count.ToString(),
          report.Settings.SubHeaderFont, Brushes.Black, marginBounds_Right - (int)size.Width, yPos);
    }

    //Print any text section for this report
    foreach (TextSection ts in report.Data.TextSections)
    {
        DrawTextSection2(ts, leftMargin, yPos, ref rect, myBrush, g);
        SkipLine(ref yPos, ref numLines);
    }

    SkipLine(ref yPos, ref numLines);

    //Print Hierarchy Report
    if (report.Settings.ReportType == ReportType.Hierachy)
    {
        recordIndex = PrintGroup2(table, numLines, recordIndex, ref yPos, g);
    }

    //Print General List Report
    else if (report.Settings.ReportType == ReportType.GeneralList)
    {
        //MessageBox.Show("About to PrintGeneralListReport2");
        recordIndex = PrintGeneralListReport2(table, numLines, recordIndex, yPos, g);
    }

    if (report.Settings.PrintPageNumbers)
    {
        //Print page number at the bottom of the page
        g.DrawString("[ " + currentPage.ToString() + " ]",
          report.Settings.SubscriptFont, Brushes.Black,
          pageBounds_Width / 2, (float)marginBounds_Bottom);
    }

    int end = table.DefaultView.Count;

    if (recordIndex >= end)
    {
        SkipLine(ref yPos, ref numLines);

        //Reset for group reports
        deltaText = String.Empty;
        deltaText2 = String.Empty;

        //Print Grand Totals
        PrintGrandTotals2(myBrush, linePen, leftMargin, ref yPos, g);

        hasMorePages = false;

        //Reset variables
        recordIndex = 0;
        numPages = currentPage;

        PictureBox dd = new PictureBox();
        dd.Size = new Size(pageSize_Width, pageSize_Height);
        dd.Image = image;
        display.PageImages.Add(dd);

       //Add the report buttons on the left hand side
        AddPageButtons(numPages, image);

        currentPage = 1;

    }
    else
    {
        currentPage++;
        hasMorePages = true;

        PictureBox dd = new PictureBox();
        dd.Size = new Size(pageSize_Width, pageSize_Height);
        dd.Image = image;
        display.PageImages.Add(dd);
    }

    UpdateStatusbar();


    return recordIndex;
}
摘要列
StarReport 还支持以下聚合函数:
-
Sum 最大最小值-
Average Count
例如,如果我想计算我有多少病例记录,我会将我的列配置如下
ColumnCell ccase = new ColumnCell("Case ID", 100);
sr.Report.Data.SubGroup.Columns.Add(ccase);
RowCellInfo ccaseIDInfo = new RowCellInfo("Case ID", 100);
ccaseIDInfo.FunctionType = FunctionType.Count;
ccaseIDInfo.PrintSummaryLine = true;
ccaseIDInfo.RowCell.FormatString = "D8";
ccaseIDInfo.RowCell.DataType = DataType.Int32;
在内部,StarReport 执行所有必要的计算,然后将结果放置在报告底部。有一个 NumberCollection 对象负责执行所有聚合。有一个 PrintTotals 过程用于打印总计。请注意,我们传入了来自 Bitmap 的 Graphics 对象。
private void PrintTotals(RowCellInfo cellInfo, SolidBrush myBrush, int x, float y, Graphics g)
{
   SizeF size = g.MeasureString(cellInfo.SummaryText + cellInfo.NumberCollection.GetSum().ToString(
     cellInfo.SummaryFormatString.Trim()), cellInfo.RowCell.Font);

   if (cellInfo.RowCell.ExtendToMargin)
   {
       int rightMargin = marginBounds_Right;

       x = rightMargin - (int)size.Width;
    }
    else
      x = x - (int)size.Width;

    //Print Totals
    Debug.WriteLine("Printing Totals");
    switch (cellInfo.FunctionType)
    {
        case FunctionType.Average:
          g.DrawString(cellInfo.AverageText + cellInfo.NumberCollection.GetAverage().ToString(
            cellInfo.SummaryFormatString.Trim()), report.Settings.SummaryLineFont, myBrush, x, y);
          break;
         case FunctionType.Summary:
           g.DrawString(cellInfo.SummaryText + cellInfo.NumberCollection.GetSum().ToString(
             cellInfo.SummaryFormatString.Trim()), report.Settings.SummaryLineFont, myBrush, x, y);
          break;
         case FunctionType.Maximum:
            g.DrawString(cellInfo.MaximumText + cellInfo.NumberCollection.GetMaximum().ToString(
              cellInfo.SummaryFormatString.Trim()), report.Settings.SummaryLineFont, myBrush, x, y);
          break;
         case FunctionType.Minimum:
            g.DrawString(cellInfo.MinimumText + cellInfo.NumberCollection.GetMinimum().ToString(
              cellInfo.SummaryFormatString.Trim()), report.Settings.SummaryLineFont, myBrush, x, y);
            break;
         case FunctionType.Count:
            g.DrawString(cellInfo.CountText + cellInfo.NumberCollection.GetCount().ToString(
              cellInfo.SummaryFormatString.Trim()), report.Settings.SummaryLineFont, myBrush, x, y);
            break;
    }
}
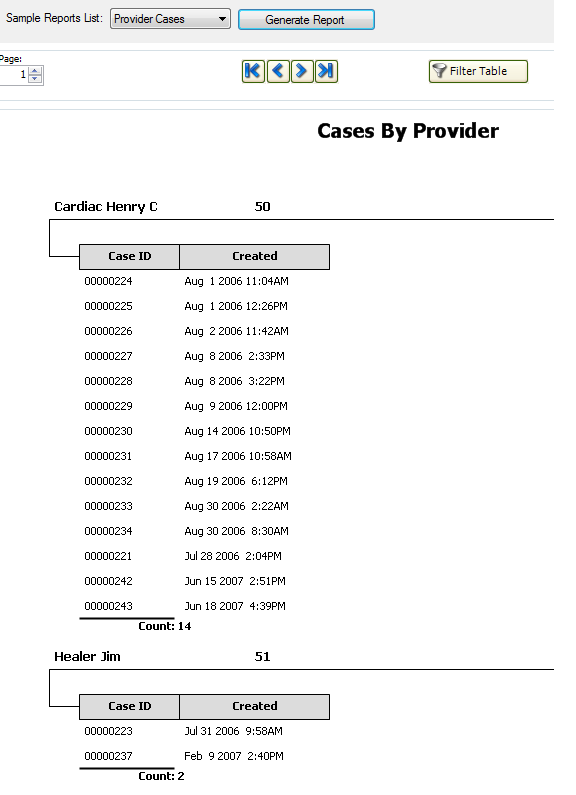
层次结构报告
StarReport 也支持层次结构报告类型。例如,假设我们有一个数据表,其中包含以下列:
- 提供商
- 病例 ID
- 创建日期
- 描述
假设我们想按提供者分组报告,然后计算每个提供者有多少病例。以下代码(也包含在演示下载中)将实现此目的。
private void PrintReferringProviderCases()
{
    DataTable table = GetPopulatedFromSomeWhere();

    StarReport sr = new StarReport();
    sr.Report.Settings.ReportType = ReportType.Hierachy;
    sr.Report.Settings.Header.ReportTitle = "Referring Provider's Cases";
    sr.Report.Settings.PrintRowSeparator = true;
    sr.Report.Settings.GroupIndentSpace = 20;


    //Column Provider Name
    ColumnCell providerName = new ColumnCell();
    providerName.Width = 200;
    providerName.Text = "Provider";

    RowCellInfo providerNameInfo = new RowCellInfo();
    providerNameInfo.DatabaseField = "Provider";
    providerNameInfo.Delta = true; // This is the pivot column
    providerNameInfo.RowCell.Width = 200;
    providerNameInfo.RowCell.Font = new Font("Tahoma", 10, FontStyle.Bold);

    //Display column in the second group
    sr.Report.Data.Group.RowCellInfos.Add(providerNameInfo);


    //Column Case
    ColumnCell ccase = new ColumnCell("Case ID", 100);
    sr.Report.Data.SubGroup.Columns.Add(ccase);

    RowCellInfo ccaseIDInfo = new RowCellInfo("CaseID", 100);
    ccaseIDInfo.FunctionType = FunctionType.Count;
    ccaseIDInfo.PrintSummaryLine = true;
    ccaseIDInfo.RowCell.FormatString = "D8";
    ccaseIDInfo.RowCell.DataType = DataType.Int32;

    // Display column in the second group
    sr.Report.Data.SubGroup.RowCellInfos.Add(ccaseIDInfo);

    ColumnCell dateCreated = new ColumnCell("Date Created", 150);
    RowCellInfo dateCreatedInfo = new RowCellInfo("DateCreated", 150);

    sr.Report.Data.SubGroup.Columns.Add(dateCreated);

    ColumnCell description = new ColumnCell("Description");
    description.ExtendToMargin = true;
    sr.Report.Data.SubGroup.Columns.Add(description);

    RowCellInfo descriptionInfo = new RowCellInfo("Description");
    descriptionInfo.RowCell.ExtendToMargin = true;

    sr.Report.Data.SubGroup.RowCellInfos.Add(dateCreatedInfo);

    sr.Report.Data.SubGroup.RowCellInfos.Add(descriptionInfo);

    sr.GenerateReport(table, PrintPageDisplay.PREVIEW);

}
请注意,有一个 Group 和 SubGroup 集合。这些集合用于确定哪些组列将进入。另请注意,有一个 Delta 属性。此属性表示“分组依据”字段。
预览
通用报告 UI

在报告的左侧,我们有一系列可点击的页面图标。它们包含实际显示报告的微缩视图。通过点击它们,我们可以跳转到特定页面。在这个特定报告中,有六页。您还可以从此主屏幕筛选报告,执行打印预览,打印,或在报告页面中向前或向后移动。
筛选视图

排序视图

示例老化报告

示例病例报告
使用代码
我已在下载和源代码中包含了许多报告示例。从下面的代码示例中可以看到,几乎所有内容都是可配置的。
private void PrintPatientList()
{
    DataTable table = new DataTable();
    DataSet ds = new DataSet();
    ds.ReadXml("Patients.xml");
    table = ds.Tables[0];

    sr.Report.Settings.ReportType = ReportType.GeneralList;
    sr.Report.Settings.Header.ReportTitle = "Patient Master List";
    sr.Report.Settings.OutlineTable = true;
    sr.Report.Settings.PrintTableGrid = true;
    sr.Report.Settings.PrintTotalRecords = true;
    sr.Report.Settings.TotalText = "Total Records";
    sr.PageSettings.Landscape = true;

    //NAME
    ColumnCell name = new ColumnCell("Name", 200);
    RowCellInfo nameInfo = new RowCellInfo("Name", 200);
    nameInfo.RowCell.CellFormat.FormatFlags = StringFormatFlags.NoClip;
    nameInfo.RowCell.Font = new Font(nameInfo.RowCell.Font, FontStyle.Bold);
    name.RowCellInfoCollection.Add(nameInfo);

    sr.Report.Data.ColumnCellCollection.Add(name);

    //ID
    ColumnCell id = new ColumnCell("Chart No.", 70);
    RowCellInfo idInfo = new RowCellInfo("ID", 70);
    idInfo.RowCell.DataType = DataType.Int32;
    idInfo.RowCell.FormatString = "D8";
    id.RowCellInfoCollection.Add(idInfo);
    sr.Report.Data.ColumnCellCollection.Add(id);

    //DOB
    ColumnCell dob = new ColumnCell("DOB", 70);
    RowCellInfo dobInfo = new RowCellInfo("DOB", 70);
    dob.RowCellInfoCollection.Add(dobInfo);
    sr.Report.Data.ColumnCellCollection.Add(dob);

    //SOCIAL
    ColumnCell ss = new ColumnCell("SS#");
    RowCellInfo ssInfo = new RowCellInfo("SocialSecurity");
    ss.RowCellInfoCollection.Add(ssInfo);

    //GENDER
    ColumnCell genderCol = new ColumnCell("Gender", 60);
    RowCellInfo genderInfo = new RowCellInfo("Gender", 60);
    genderCol.RowCellInfoCollection.Add(genderInfo);
    sr.Report.Data.ColumnCellCollection.Add(genderCol);

    //PHONE
    ColumnCell phoneCol = new ColumnCell("Phone", 150);
    RowCellInfo phoneInfo = new RowCellInfo("Phone", 150);
    phoneCol.RowCellInfoCollection.Add(phoneInfo);
    sr.Report.Data.ColumnCellCollection.Add(phoneCol);

    //ADDRESS
    ColumnCell addressCol = new ColumnCell("Address", 200);
    RowCellInfo addressInfo = new RowCellInfo("Address", 200);
    addressCol.RowCellInfoCollection.Add(addressInfo);
    sr.Report.Data.ColumnCellCollection.Add(addressCol);

    //CITY
    ColumnCell cityCol = new ColumnCell("City", 150);
    RowCellInfo cityInfo = new RowCellInfo("City", 150);
    cityCol.RowCellInfoCollection.Add(cityInfo);

    sr.Report.Data.ColumnCellCollection.Add(cityCol);

    //STATE
    ColumnCell stateCol = new ColumnCell("State", 40);
    RowCellInfo stateInfo = new RowCellInfo("State", 40);
    stateCol.RowCellInfoCollection.Add(stateInfo);
    sr.Report.Data.ColumnCellCollection.Add(stateCol);

    //Zip
    ColumnCell zipCol = new ColumnCell("Zip", 50);
    zipCol.ExtendToMargin = true;
    RowCellInfo zipInfo = new RowCellInfo("Zip", 50);
    zipCol.RowCellInfoCollection.Add(zipInfo);
    sr.Report.Data.ColumnCellCollection.Add(zipCol);
    zipInfo.RowCell.ExtendToMargin = true;

    sr.GenerateReport(table, PrintPageDisplay.PREVIEW);
关注点
StarReport 还支持自由格式报告。您可以在报告中的任何位置放置任何内容并进行打印。此功能可用于创建自己的表单,使用文本和矩形作为文本框进行打印。我将在稍后添加更多关于如何实现此功能的示例。我还计划在未来让 UI 更加美观。