
预测近期 COVID 死亡率
5.00/5 (3投票s)
利用先前的病例和死亡人数,根据当前的病例数预测未来的死亡率。
引言
COVID Tracking Project 每日发布一个精选数据集,包含全球 COVID 病例、住院人数、死亡人数和其他数据点。美国的数据报告似乎侧重于滞后指标,如报告病例和迄今为止的死亡人数。因此,利用 Tracking Project 的数据,让我们看看病例和未来死亡人数之间的相关性。正如你可能预期的那样,两者之间存在可靠的关系。
使用代码
Python 和 Jupyter Notebook 是进行此类实验和可视化的绝佳工具。Pandas、numpy、matplotlib 和 SKLearn 提供了足够的功能来进行直接分析。
startDate = np.datetime64('2020-06-24') # the earliest date in the data to use
country = 'USA' # the country code to analyse

# load and filter the dataset to just the locale and period of interest
raw_data = pd.read_csv('https://covid.ourworldindata.org/data/owid-covid-data.csv',
           usecols=['date', 'iso_code', 'new_deaths', 'new_cases', 'new_deaths_smoothed',
           'new_cases_smoothed'], parse_dates=['date'])
df = raw_data[(raw_data.iso_code == country) & (raw_data.date >= startDate) &
    (~raw_data.new_deaths.isnull()) &
    (~raw_data.new_cases.isnull()) &
    (~raw_data.new_deaths_smoothed.isnull()) &
    (~raw_data.new_cases_smoothed.isnull())]
df.info()
对美国的数据集进行了一些初步探索后,很明显病例和死亡人数之间存在线性关系。从那里,相对容易地将病例数据从死亡人数数据中偏移几天,并找到具有最佳 r2 值的偏移量。
Model = namedtuple('Model', 'linearRegression r2 offset data')

def BestFitModel(new_cases, new_deaths, max_offset) -> Model:
    best = Model(None, 0.0, 0, None)

    # find an offset, in days, where cases best correlate to future deaths
    for offset in range(1, max_offset):
        cases = new_cases[-0:-offset]
        deaths = new_deaths[offset:]

        model = LinearRegression().fit(cases, deaths)
        predictions = model.predict(cases)
        r2 = metrics.r2_score(deaths, predictions)
        if (r2 > best.r2):
            best = Model(model, r2, offset,
                         pd.DataFrame({'predicted': predictions, 'actual': deaths}))

    return best
结果
报告数据存在噪音(周末和节假日的数据报告不足),并且波动很大。即使存在这种噪音,数据也显示了在 14 到 21 天偏移量之间存在很强的相关性。这几乎总是 7 的倍数,因为周末模式。


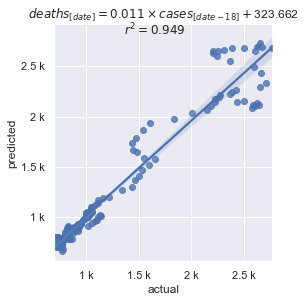
平滑后的数据点,包含在 Tracking Project 的数据集中,消除了周末模式,但感恩节和圣诞节的报告不足仍然存在。尽管如此,相关性仍然大于 0.94。

一旦找到最佳拟合的线性方程,就可以直接预测未来几天(等于用于找到该方程的偏移量)的死亡人数。
def Predict(model: Model, dates, cases, deaths) -> pd.DataFrame:
    # create a new date series for the range over which we will predict
    # (it is wider than the source date range by [offset].
    #  That is how far in the future we can predict)
    minDate = np.amin(dates)
    maxDate = np.amax(dates) + np.timedelta64(model.offset + 1, 'D')

    projected_dates = [date for date in np.arange(minDate, maxDate, dt.timedelta(days=1))]

    # padding so actuals and predictions can be graphed together within dates
    padding = pd.Series(np.full(model.offset, np.nan))

    actual_deaths = deaths.append(padding)
    projected_deaths = padding.append(pd.Series(model.linearRegression.predict(cases)))

    frame = pd.DataFrame({"dates": projected_dates,
        "actual": actual_deaths.values,
        "projected": projected_deaths.values}, index=projected_dates)

    # unpivot the data set for easy graphing
    return frame.melt(id_vars=['dates'], var_name='series', value_name='deaths')

关注点
对于好奇的人来说,结果会每天更新并发布到 GitHub。
历史
- 2021 年 1 月 2 日 - 首次发布