
HTML5 条形图
4.93/5 (44投票s)
一个用于 3D 条形图的 jQuery 插件。

目录
- 引言
- 系统要求
- jQuery 插件:一些好的实践
- Paper JS 插件
- 图表标题
- 刻度线(标尺)
- 幅度标题
- 刻度
- 类别名称
- 启动动画
- 3D 条形
- 将颜色名称转换为十六进制代码
- 浮动弹出窗口
- 最终思考
- 历史
引言
当程序员遇到之前解决过的问题时,他们通常会依赖代码重用,以及他们自己先前获得的软件知识来构建新软件。随着软件开发的成熟,代码重用过程通常会变得更加标准化,其中包括技术、实现集合和抽象,例如软件库、设计模式和框架,以便团队中的其他开发人员可以利用通用知识/代码实现重用。当涉及到 JavaScript 开发时,无处不在的 jQuery 库的存在有时会导致 插件 的开发,这是一种更广泛的代码重用形式,因为它们可以公开并帮助更广泛的开发社区。
本文探讨了两种独立且截然不同的编程能力:第一种是设计自己的 jQuery 插件的能力(即扩展 jQuery 的美元符号的实用性),另一种是使用现有的免费库绘制自己的 3D 条形图的艺术,而无需依赖第三方工具。
本文的目标不是提供一个 100% 专业、无懈可击的 3D 图表工具,也不是一个终极的 jQuery 插件,而是尝试为您指明如何使用简单工具制作简单事物。
系统要求
本文包含运行网站所需的代码,除了 JavaScript 之外不依赖任何编程语言,因此无需引用程序集或 C# 代码,所以不需要编译。您只需要一个运行网站的开发环境,例如 Visual Studio 或 Visual Studio Express 2012 for Web。
jQuery 插件:一些好的实践
当开发人员决定编写 jQuery 插件时,他们可能不仅希望抽象功能并重用代码,还希望与 jQuery 开发社区共享一些有用的代码。但也有您决定创建自己的 jQuery 插件作为编程练习的情况。无论哪种情况,请记住,有一些值得遵循的指南,以获得成功、节省时间并避免糟糕的意外。从小处着手,使您的代码符合最佳实践,并在编码过程中进行改进。您可以在 jQuery 的 Plugins/Authoring 文档页面上了解更多关于 jQuery 插件最佳实践的信息。
我们必须首先在 JavaScript 代码中创建一个立即调用的函数表达式(IIFE)。IIFE 是一种设计模式,它提供了插件范围内私有函数变量和函数的自包含性,从而避免了污染 JavaScript 的全局环境。JavaScript 开发人员会很容易地通过以下代码识别 IIFE 模式:
(function(){
      /* code */
    }());
在上面的代码中,最外层的括号将函数包装在一个表达式中,并立即强制其求值。最后一行代码中的括号立即调用了该函数。
在 jQuery 插件开发中,重要的是将 **jQuery** 引用作为参数传递到我们的 IIFE 表达式中,以便可以在插件的作用域内安全地使用美元符号 ($),而不会冒被外部库覆盖美元符号的风险。
(function($){
      /* jQuery Plugin code goes here. Notice the $ sign will never have a meaning other than the jQuery object. */
    }(jQuery));
接下来,我们创建将包含并执行我们整个条形图插件功能的函数。注意 `options` 参数,它将包含所有初始化设置,用于根据条形图的要求配置条形图。
(function($){
  $.fn.barChart = function (options) {
        //as expected, our plugin code falls here.
    }
}(jQuery));
在插件函数内部,上下文由 `this` JavaScript 关键字提供。大多数情况下,开发人员会试图通过将上下文包装在美元符号(即 jQuery)函数中来引用上下文:“`$(this)`”,而不是直接引用 `this`。这是一个常见的错误,因为 **this** 关键字已经引用了 jQuery 对象,而不是正在创建条形图的 DOM 元素。
(function($){
  $.fn.barChart = function (options) {
        var self = this;
    }
}(jQuery));
在上面的 JavaScript 代码中,我们将 `this` 对象的 قيمة 存储在 `self` 引用中。这对于 **函数** 尤其需要,因为 `this` 关键字的行为是函数本身的上下文,而不是最外层插件函数的上下文。因此,`self` 将被用作条形图插件的上下文。
插件代码首先定义一系列设置,这些设置将成为大多数常见配置的默认值。这将为我们的插件用户提供方便的标准值,这些值可以被配置(允许灵活的图表组件)或忽略(以便插件用户可以提供最少的启动配置)。
随着插件组件变得越来越复杂,提供更全面、更完善的默认设置通常是个好主意,以便为用户提供强大、灵活且不干扰的插件。
$.fn.barChart = function (options) {

var self = this;
this.empty();

// Create some defaults, extending them with any options that were provided
var settings = $.extend({
    'id': generateGuid(),
    'discreteValueField': 'value',
    'categoryField': 'name',
    'colorField': 'color',
    'scaleText': 'values',
    'font': 'helvetica, calibri',
    'border': '1px solid #c0c0c0',
    'backgroundColor': '#FBEDBB',
    'title': '',
    'width': null,
    'height': null,
    'marginTop': 60,
    'marginLeft': 40,
    'marginRight': 15,
    'marginBottom': 15,
    'axisWidth': 50,
    'xLabelsHeight': 80,
    'barColor': '#ff0000',
    'depth3D': 0,
    'angle': 0,
    'onDataItemClick': null
}, options);
Paper JS 插件

Html5 条形图插件严重依赖于出色的 Paper JS 库。PaperJS 由 Jürg Lehni 和 Jonathan Puckey 开发,是一个开源的 HTML5 矢量图形脚本库,它运行在 HTML5 canvas 元素之上,提供了一个强大的编程接口和设计精良的接口。PaperJs 与 Scriptographer 兼容,Scriptographer 是一个具有十年以上开发历史的 Adobe Illustrator 脚本环境。
由于 HTML5 条形图需要 PaperJS,而 PaperJS 又需要 Canvas 元素,所以要求用户提供 HTML5 Canvas 元素来构建条形图是合理的。但相反,条形图插件是调用一个普通的 `div` 元素,而条形图插件本身会创建 canvas 元素。当然,这里我们使用的是标准的 jQuery DOM 元素创建语法。请注意下面代码片段的最后一行,我们将新创建的 canvas 元素追加到目标 DOM div 元素(由 `this` 关键字引用)。
var newCanvas =
$('<canvas>').attr({
    id: settings.id,
    width: settings.width,
    height: settings.height
}).css({
    border: settings.border,
    backgroundColor: settings.backgroundColor
});
this.append(newCanvas);
默认情况下,当您开始使用 Paper JS 时,该库会自动创建一个所谓的“Paper Scope”,即一个绑定到 Paper JS 将要渲染图形的 canvas 的作用域对象。这个默认作用域由 `paper` 实例提供。但由于我们可能需要在同一页面中创建多个图表(绑定到多个 canvas),所以我们应该为每个图表创建一个 PaperScope。下面一行生成了一个全新的 `PaperScope` 实例。
paper = new paper.PaperScope();最后,我们将 Paper Scope 绑定到我们的 canvas。
paper.setup(newCanvas.attr('id'));图表标题
我们通过定义一个新的 `PointText` 对象来渲染条形图标题,该对象包含在初始条形图设置中配置的标题。图表标题需要进行一些调整,例如将布局定义为居中对齐,并将其定位在 canvas 视图的水平中心点。

//Rendering the bar chart title
var text = new PointText(paper.view.viewSize.width / 2, 15);
text.paragraphStyle.justification = 'center';
text.characterStyle.fontSize = 10;
text.characterStyle.font = settings.font;
text.content = settings.title;
条形图的大部分元素将围绕水平和垂直轴相交的点排列,因此定义一个包含零点坐标的对象变量非常方便。请注意,边距已从计算中扣除。
//The Zero Point defines where the two axes cross each other
var zeroPoint = {
    x: settings.marginLeft + settings.axisWidth,
    y: paper.view.viewSize.height - settings.marginBottom - settings.xLabelsHeight
}
刻度线(标尺)
接下来,我们定义 `Path` 对象,它代表图表左侧的垂直线。这条线将用作刻度本身的边距。
//Rendering the left (scale) line
var leftPath = new Path();
leftPath.strokeColor = 'black';
leftPath.add(zeroPoint.x, settings.marginTop);
leftPath.add(zeroPoint.x, zeroPoint.y);
由于条形图是关于数字的比较,因此显然只有考虑所有值才可能渲染条形。也就是说,我们应该首先从数据数组中找出最大和最小的离散值,然后才能正确渲染条形。
//Discovering the maximum and minimum discrete values
var xOffset = 0;
var dataItemBarAreaWidth = (paper.view.viewSize.width - settings.marginLeft - settings.marginRight -
    settings.depth3D - settings.axisWidth) / settings.data.length;
$(settings.data).each(function (index, item) {
    var value = item[settings.discreteValueField];
    maxDiscreteValue = Math.max(maxDiscreteValue, value);
    minDiscreteValue = Math.min(minDiscreteValue, value);
    item.value = value;
    item.originalValue = value;
});
幅度标题
根据数字的大小,我们的条形图可能会出现混乱的数字。幸运的是,`magnitude` 变量可以胜任这项任务,通过将数字按千、百万等进行分割来简化数据可视化,使条形图更易于阅读和理解。

//Discovering the magnitude value based on the maximum discrete value
var magnitude = 1;
var magnitudeLabel = '';
if (maxDiscreteValue > 1000000000) {
    magnitude = 1000000000;
    magnitudeLabel = '(in billions)'
}
else if (maxDiscreteValue > 1000000) {
    magnitude = 1000000;
    magnitudeLabel = '(in millions)'
}
else if (maxDiscreteValue > 1000) {
    magnitude = 1000;
    magnitudeLabel = '(in thousands)'
}
一旦找到 `magnitude` 值,就必须重新缩放数据集中的每一个值。
//Each value must be re-scaled based on the magnitude
$(settings.data).each(function (index, item) {
    item.value = item.value / magnitude;
});

maxDiscreteValue = maxDiscreteValue / magnitude;
minDiscreteValue = minDiscreteValue / magnitude;
当缩放后的最大值有太多位数时,正确显示会是个问题。这就是为什么使用四舍五入方法,这样就不会出现过多的位数。
//Rounding the numbers to the same number of digits
var maxDiscreteValueLength = (parseInt(maxDiscreteValue + '').toString()).length - 2;
var roundLimit = Math.pow(10, maxDiscreteValueLength);
var maxScaleValue = Math.ceil(maxDiscreteValue / roundLimit) * roundLimit;
刻度
在所有数字都正确缩放后,我们现在必须在刻度线旁边写出所有的刻度值(任意定义为 5 个不同的值),从零开始,到最大刻度值结束。再次,实例化一个 `PointText` 对象,然后将其定位在刻度线的左侧。每个刻度值都必须四舍五入,使其位数不过多。

//Rendering the scale values
var scaleCount = 5;
var lastScaleValue = 0;
for (var scale = 0; scale <= scaleCount; scale++) {
    var y = zeroPoint.y - scale * (zeroPoint.y - settings.marginTop) / scaleCount;

    var scaleText = new PointText(zeroPoint.x - 10, y + 5);
    scaleText.paragraphStyle.justification = 'right';
    scaleText.characterStyle.fontSize = 8;
    scaleText.characterStyle.font = settings.font;
    var value = ((maxScaleValue - 0) / scaleCount) * scale;

    if (value.toString().length - lastScaleValue.toString().length > 2) {
        var lastDigitsCount = (lastScaleValue.toString().length - parseInt(lastScaleValue).toString().length) - 1;
        var pow = Math.pow(10, lastDigitsCount);
        value = parseInt(pow * value) / pow;
    }
    scaleText.content = addCommas(value);

    lastScaleValue = value;
    var scalePath = new Path();
    scalePath.strokeColor = 'black';
    scalePath.add(zeroPoint.x - 5, y);
    scalePath.add(zeroPoint.x, y);
}
类别名称
最后,我们绘制水平底线,它将把条形图中的条形与类别名称分开。

//Rendering the horizontal (bottom) line
var bottomPath = new Path();
bottomPath.strokeColor = 'black';
bottomPath.add(zeroPoint.x, zeroPoint.y + 1);
bottomPath.add(paper.view.viewSize.width - settings.marginRight, zeroPoint.y + 1);
在左边距处,我们放置一个标题,解释离散值的含义。请注意,`PointText` 实例旋转了 270 度,这意味着文本从图表的底部流向顶部。
//The rotated caption for the discrete values
var discreteValuesCaption = new PointText(settings.marginLeft * .5, paper.view.viewSize.height / 2);
discreteValuesCaption.paragraphStyle.justification = 'center';
discreteValuesCaption.characterStyle.fontSize = 11;
discreteValuesCaption.characterStyle.font = settings.font;
discreteValuesCaption.content = settings.discreteValuesCaption;
discreteValuesCaption.rotate(270);

maxDiscreteValueLength = (parseInt(maxDiscreteValue + '').toString()).length - 2;
roundLimit = Math.pow(10, maxDiscreteValueLength);
maxScaleValue = Math.ceil(maxDiscreteValue / roundLimit) * roundLimit;
在离散值标题旁边,是值的幅度的标题。这很重要,这样用户就不会将刻度数字误认为是纯粹的标题,而是也会考虑幅度。
//The rotated caption for the magnitude
var discreteValuesCaption2 = new PointText(settings.marginLeft, paper.view.viewSize.height / 2);
discreteValuesCaption2.paragraphStyle.justification = 'center';
discreteValuesCaption2.characterStyle.fontSize = 12;
discreteValuesCaption2.characterStyle.font = settings.font;
discreteValuesCaption2.content = magnitudeLabel;
discreteValuesCaption2.rotate(270);
由于条形图具有 3D 效果,我们必须计算该 3D 图形右上角的坐标,这将用于绘制每个图表条。
//The {x,y} offset point, used to define the deep corner of the bar
depth3DPoint = {
    x: -settings.depth3D * Math.cos(settings.angle * (Math.PI / 180)),
    y: settings.depth3D * Math.sin(settings.angle * (Math.PI / 180)),
};
现在我们再次使用一个新的 `PointText` 实例在水平底线下方渲染类别名称。请注意,为了节省图表空间,类别名称旋转了 270 度,这意味着文本现在从图表的底部流向顶部。
//Creates one bar for each category
$(settings.data).each(function (index, item) {
    var value = item.value;
    var originalValue = item.originalValue;
    var categoryName = item[settings.categoryNameField];
    var color = item[settings.colorField];

    var middleX = zeroPoint.x + dataItemBarAreaWidth * index + dataItemBarAreaWidth / 2;

    //Generates and renders the category bar
    var g = new html5Chart.Bar(
        {
            categoryName: categoryName,
            value: value,
            originalValue: originalValue,

            middleX: middleX,
            dataItemBarAreaWidth: dataItemBarAreaWidth,
            barHeightRatio: barHeightRatio,

            depth3DPoint: depth3DPoint,
            zeroPoint: zeroPoint,
            color: color
        });
    bars.push(g);

    //We set the hidden span's html value so that jQuery width() and height() functions can calculate the
    //dimensions of the rendered, then we used them to position the text.
    $(newHiddenSpan).html(categoryName);

    var barLabelLineX = zeroPoint.x + dataItemBarAreaWidth * index + dataItemBarAreaWidth / 2;

    var barLabelLine = new Path();
    barLabelLine.strokeColor = 'black';
    barLabelLine.add(barLabelLineX, zeroPoint.y);
    barLabelLine.add(barLabelLineX, zeroPoint.y + 5);

    //Renders the category names below the bars
    var barLabel = new PointText(barLabelLineX + 5, zeroPoint.y +
                        $(newHiddenSpan).width() / 2 + categoryNameMargin);
    barLabel.paragraphStyle.justification = 'center';
    barLabel.characterStyle.fontSize = 10;
    barLabel.characterStyle.font = settings.font;
    barLabel.content = categoryName;
    barLabel.rotate(270);
});
正如预期的那样,`draw` 方法负责渲染视图。
paper.view.draw();启动动画
当条形图首次显示在 canvas 元素上时,我们不会简单地显示静态图像,而是启动一个漂亮的动画,其中每个条形都从零高度开始,直到达到其定义的高度。这个功能在任何项目中可能优先级都很低,但它增加了有趣的视觉效果,以专业的方式吸引用户的注意力来查看显示的数据。
//Generates the initial animation
var animationPercPerFrame = 5;
var ellapsedTime = 0;
var accumulatedBarHeight = 0;
paper.view.onFrame = function (event) {
    ellapsedTime += event.time;

    var animationCount = 0;
    animationPercPerFrame = easingOut(ellapsedTime, 0, 100, 40);
    $(bars).each(function (index, bar) {
        var animationResult = bar.animate(animationPercPerFrame);

        if (animationResult.animated > 0) {
            animationCount++;
        }
        accumulatedBarHeight += animationResult.step;
    });
    if (animationCount == 0) {
        paper.view.onFrame = null;
    }
}
3D 条形
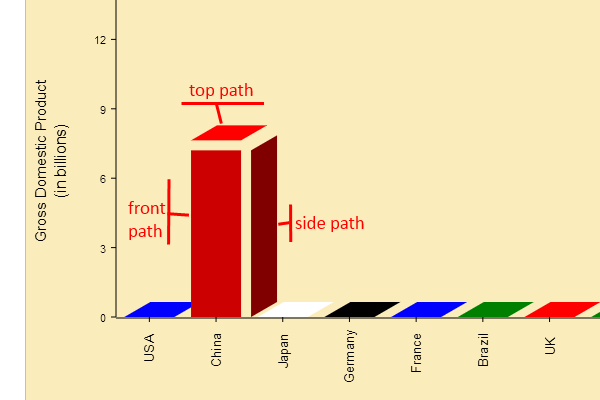
将类别条视为一个对象是一个合理的决定。也就是说,每个条都需要初始化,并具有预定义的属性和方法。但我们没有从头开始创建一个全新的对象,而是扩展了 Paper JS 的 `Group` 对象。`Group` 对象是项目的集合,这种 Paper JS 对象对于我们的类别条对象特别有用,因为底层的 `Group` 对象可以包含条的 3 个视觉组件:正面、顶面和左侧面。
//Renders the bar chart bar as a group of Paper JS items
html5Chart.Bar = Group.extend({
    initialize: function (config, items) {
        ...
    },
    createBarSidePath: function (color, p1, p2, p3, p4) {
        ...
    },
    getFrontPolygonPath: function () {
        ...
    },
    getTopPolygonPath: function () {
        ...
    },
    getSidePolygonPath: function () {
        ...
    },
    setBarTopY: function (y) {
        ...
    },
    animate: function (animationPercPerFrame) {
        ...
    },
    colourNameToHex: function (colour) {
        ...
    }
});
正如预期的那样,`html5Chart.Bar` 的初始化将接收渲染条形图所需的基本设置。正如我们稍后将看到的,`categoryName` 和 `originalValue` 属性用于渲染当用户将鼠标悬停在条形图上时显示的包含类别数据的标题气泡。`zeroPoint` 提供代表条形图底线的 **y** 坐标。`middleX` 是表示条形区域中间位置的水平偏移量。`dataItemBarAreaWidth` 是为每个条形分配的空间量。参数 `barHeightRatio` 是根据最大离散值预先计算的像素/值比率。最后,`depth3DPoint` 是测量相对于条形正面顶角偏移距离的坐标对。然后,点码中的基数点指示点相对于条形的位置。
初始化函数还有一个有趣的方面是颜色方案。由于我们渲染的是 3D 条形图,如果用相同的颜色绘制条形的每一面,它们看起来会不真实。所以,如果我们调整颜色的 RGB(红/绿/蓝)分量以在 3D 条形中创建明暗效果,那就太好了。从十六进制颜色值解析 RGB 分量相对简单,正如下面的代码片段所示。但当用户为条形图提供命名颜色时,问题会变得更难。在这种情况下,`colourNameToHex`(显然)使用一个简单的字典将硬编码的颜色名称转换为它们对应的十六进制值。
最后,初始化了底层 `Group` 对象的 `children` 集合属性,然后将条形的 3 个面(创建为 `Path` 对象)添加到此组的子项中。
initialize: function (config, items) {
this.categoryName = config.categoryName;
this.value = config.value;
this.originalValue = config.originalValue;
this.zeroPoint = config.zeroPoint;
this.middleX = config.middleX;
this.dataItemBarAreaWidth = config.dataItemBarAreaWidth;
this.barHeightRatio = config.barHeightRatio;
this.depth3DPoint = config.depth3DPoint;
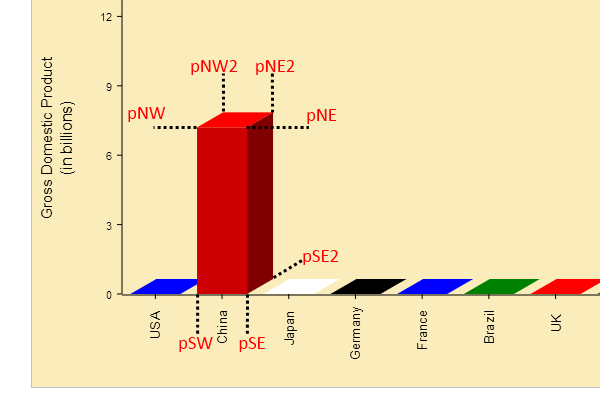
//The cardinal points in the point codes indicate the position of the points regarding to the bar.
var pNW = { x: this.middleX - (this.dataItemBarAreaWidth * .75) / 2,
y: this.zeroPoint.y - this.barHeightRatio * this.value };
var pNE = { x: this.middleX + (this.dataItemBarAreaWidth * .75) / 2,
y: this.zeroPoint.y - this.barHeightRatio * this.value };
var pSW = { x: this.middleX - (this.dataItemBarAreaWidth * .75) / 2, y: this.zeroPoint.y };
var pSE = { x: this.middleX + (this.dataItemBarAreaWidth * .75) / 2, y: this.zeroPoint.y };
var pNW2 = { x: pNW.x - this.depth3DPoint.x, y: pNW.y - this.depth3DPoint.y };
var pNE2 = { x: pNE.x - this.depth3DPoint.x, y: pNW.y - this.depth3DPoint.y };
var pSW2 = { x: pSW.x - this.depth3DPoint.x, y: pSW.y - this.depth3DPoint.y };
var pSE2 = { x: pSE.x - this.depth3DPoint.x, y: pSW.y - this.depth3DPoint.y };
this.bottomValue = pSE.y;
this.topValue = pNE.y;
this.currentValue = pSE.y;
var color = config.color;
var color2 = config.color2;
var color3 = config.color3;
var hexColor = this.colourNameToHex(color);
if (!hexColor)
hexColor = color;
if (hexColor) {
var r = hexColor.substring(1, 3);
var g = hexColor.substring(3, 5);
var b = hexColor.substring(5, 7);
var decR = parseInt(r, 16);
var decG = parseInt(g, 16);
var decB = parseInt(b, 16);
var darkFactor1 = .9;
var darkFactor2 = .8;
color2 = 'rgb(' + Math.round(decR * darkFactor1) + ',' +
Math.round(decG * darkFactor1) + ',' + Math.round(decB * darkFactor1) + ')';
color3 = 'rgb(' + Math.round(decR * darkFactor2) + ',' +
Math.round(decG * darkFactor2) + ',' + Math.round(decB * darkFactor2) + ')';
}
var dataItem3DPath = this.createBarSidePath(color2, pSW, pSE, pSE, pSW);
var dataItem3DTopPath = this.createBarSidePath(color, pSW, pSE, pSE2, pSW2);
var dataItem3DSidePath = this.createBarSidePath(color3, pSE, pSE2, pSE2, pSE);
items = [];
items.push(dataItem3DPath);
items.push(dataItem3DTopPath);
items.push(dataItem3DSidePath);
this.base();
this._children = [];
this._namedChildren = {};
this.addChildren(!items || !Array.isArray(items)
|| typeof items[0] !== 'object' ? arguments : items);
this.value = this.children[0].segments[2].point.y - this.children[0].segments[1].point.y;
},创建条形的每个面都相对简单:将颜色和点作为参数传递,然后从函数中返回一个表示封闭多边形的新 `Path`。
createBarSidePath: function (color, p1, p2, p3, p4) {
    var path = new Path();
    path.fillColor = color;
    path.strokeWidth = 0;
    path.add(p1.x, p1.y);
    path.add(p2.x, p2.y);
    path.add(p3.x, p3.y);
    path.add(p4.x, p4.y);
    path.closed = true;

    return path;
},
`setBarTopY` 函数重新定义了我们条形图的 3 个顶部点的定位。这在渲染图表的启动动画时尤其有用。
setBarTopY: function (y) {
    this.currentValue = y;
    var frontPolygonPath = this.getFrontPolygonPath();
    frontPolygonPath.segments[0].point.y = y;
    frontPolygonPath.segments[1].point.y = y;

    var topPolygonPath = this.getTopPolygonPath();
    topPolygonPath.segments[0].point.y = y;
    topPolygonPath.segments[1].point.y = y;
    topPolygonPath.segments[2].point.y = y - this.depth3DPoint.y;
    topPolygonPath.segments[3].point.y = y - this.depth3DPoint.y;

    var sidePolygonPath = this.getSidePolygonPath();
    sidePolygonPath.segments[0].point.y = y;
    sidePolygonPath.segments[1].point.y = y - this.depth3DPoint.y;
},
如前所述,动画为我们的条形图增添了愉悦的外观和感觉。`animate` 函数在渲染过程开始时被调用,速率约为每秒 60 帧。
animate: function (animationPercPerFrame) {
    var step = 0;
    var animated = false;
    if (this.currentValue < this.topValue) {
        this.currentValue == this.topValue;
    }
    else {
        step = (this.bottomValue - this.topValue) * (animationPercPerFrame / 100);

        var y = this.zeroPoint.y - (animationPercPerFrame / 100) * (this.bottomValue - this.topValue);

        this.setBarTopY(y);
        animated = true;
    }
    return {
        step: step,
        animated: animated
    };
},
将颜色名称转换为十六进制代码
正如我们之前看到的,`colourNameToHex` 是一个使用字典将硬编码颜色名称转换为等效十六进制值的函数。
colourNameToHex: function (colour) {
    var colours = {
        "aliceblue": "#f0f8ff", "antiquewhite": "#faebd7", "aqua": "#00ffff", "aquamarine": "#7fffd4", "azure": "#f0ffff",
        "beige": "#f5f5dc", "bisque": "#ffe4c4", "black": "#000000", "blanchedalmond": "#ffebcd", "blue": "#0000ff",
        "blueviolet": "#8a2be2", "brown": "#a52a2a", "burlywood": "#deb887",
        ...
        ...many colors later...
        ...
        "yellow": "#ffff00", "yellowgreen": "#9acd32"
    };

    if (typeof colours[colour.toLowerCase()] != 'undefined')
        return colours[colour.toLowerCase()];

    return false;
}
浮动弹出窗口

HTML5 条形图的另一个很棒的功能是浮动标题弹出窗口,当用户将鼠标悬停在某个条形图上时会显示该弹出窗口。标题显示类别名称和离散值。在我们的代码中,弹出窗口的功能已被封装为 `Group` 对象的一个扩展。
//Creates a group of Paper JS items that represent the pop up caption
//that displays the current category name and corresponding discrete value
//when the user moves the mouse over it
html5Chart.Popup = Group.extend({
    initialize: function (options) {
        var settings = this.settings = $.extend({
            'fontSize': '10',
            'font': 'helvetica, calibri',
            'color': 'color',
            'fillColor': 'orange',
            'strokeColor': 'black',
            'strokeWidth': '1'
        }, options);

        this.popupCenter = {
            x: paper.view.viewSize.width / 2,
            y: paper.view.viewSize.height / 2,
        };
        var text = '';

        $(newHiddenSpan).css('font-family', settings.font);
        $(newHiddenSpan).css('font-size', settings.fontSize * 1.6);
        $(newHiddenSpan).html(text);
        self.append(newHiddenSpan);
        var textSize = { width: 200, height: 20 };

        var popupText = new paper.PointText(textSize.width / 2, textSize.height * .75);
        popupText.paragraphStyle.justification = 'center';
        popupText.characterStyle.fontSize = settings.fontSize;
        popupText.characterStyle.font = settings.font;
        popupText.content = text;

        var rectangle = new Rectangle(new Point(0, 0), textSize);
        var cornerSize = new Size(5, 5);
        var popupBorder = new Path.RoundRectangle(rectangle, cornerSize);
        popupBorder.strokeColor = settings.strokeColor;
        popupBorder.strokeWidth = settings.strokeWidth;
        popupBorder.fillColor = settings.fillColor;
        this.base();
        this._children = [];
        this._namedChildren = {};
        this.addChildren([popupBorder, popupText]);
        this.visible = false;
        return this;
    },
    resetPopup: function (text) {
        if (this.text != text) {
            this.text = text;
            var settings = this.settings;
            $(newHiddenSpan).css('font-family', settings.font);
            $(newHiddenSpan).css('font-size', settings.fontSize * 1.6);
            $(newHiddenSpan).html(text);
            var textSize = { width: $(newHiddenSpan).width(), height: $(newHiddenSpan).height() };
            var rectangle = new Rectangle(new Point(this.position.x - textSize.width / 2,
                                          this.position.y - textSize.height / 2), textSize);
            var cornerSize = new Size(5, 5);
            var popupBorder = new Path.RoundRectangle(rectangle, cornerSize);
            popupBorder.strokeColor = settings.strokeColor;
            popupBorder.strokeWidth = settings.strokeWidth;
            popupBorder.fillColor = settings.fillColor;
            var border = this.getBorder();
            var popupText = this.getLabel();
            popupText.paragraphStyle.justification = 'center';
            popupText.characterStyle.fontSize = settings.fontSize;
            popupText.characterStyle.font = settings.font;
            popupText.content = text;
            this.removeChildren();
            this.addChildren([popupBorder, popupText]);
        }
    },
    getBorder: function () {
        return this.children[0];
    },
    getLabel: function () {
        return this.children[1];
    }
});
当用户将鼠标悬停在条形图上时,弹出窗口会显示。当鼠标离开条形图区域时,弹出窗口会隐藏。此功能得益于 **Paper JS** 的 `tool.onMouseMove` 函数,以及另一个 Paper JS 函数 (`paper.project.hitTest`),该函数测试鼠标位置与图表中已存在的条形对象。
tool.onMouseMove = function (event) {
    var hitResult = paper.project.hitTest(event.point, hitOptions);
    self.selectedItemPopup.visible = false;
    self.css('cursor', '');
    if (hitResult && hitResult.item) {
        if (hitResult.item.parent) {
            self.selectedItemPopup.position = new Point(event.point.x, event.point.y - 40);
            if (hitResult.item.parent.categoryName) {
                if (selectedBar) {
                    if (selectedBar != hitResult.item.parent) {
                        selectedBar.opacity = 1;
                        selectedBar.strokeWidth = 0;
                        selectedBar.strokeColor = undefined;
                        self.selectedItemPopup.visible = false;
                        self.css('cursor', '');
                    }
                }
                selectedBar = hitResult.item.parent;
                selectedBar.opacity = .5;
                selectedBar.strokeWidth = 1;
                selectedBar.strokeColor = 'black';
                self.selectedItemPopup.visible = true;
                self.css('cursor', 'pointer');
                if (self.selectedItemPopup.resetPopup) {
                    var value = selectedBar.originalValue;
                    value = parseInt(value * 100) / 100;
                    self.selectedItemPopup.resetPopup(selectedBar.categoryName + ': ' + addCommas(value));
                }

                if (settings.onDataItemMouseMove) {
                    settings.onDataItemMouseMove({
                        categoryName: selectedBar.categoryName,
                        value: selectedBar.originalValue
                    });
                }
            }
        }
    }
    else {
        if (selectedBar) {
            selectedBar.opacity = 1;
            selectedBar.strokeWidth = 0;
            selectedBar.strokeColor = undefined;
            selectedBar = null;
            self.css('cursor', '');
        }
    }
}
每当用户单击某个类别条形图区域时,条形图插件会响应,返回该类别的类别名称和值。当然,只有当用户事先订阅了该事件回调时,`onDataItemClick` 回调才会被调用。
tool.onMouseUp = function () {
    if (selectedBar) {
        if (settings.onDataItemClick) {
            settings.onDataItemClick({
                categoryName: selectedBar.categoryName,
                value: selectedBar.originalValue
            });
        }
    }
}
最终思考
本文总结了使用 jQuery 插件和 Paper JS 库开发条形图(以及其他图形工具)所需的基本技术。我希望本文的解释相当清楚,并且在任何情况下都为将来的改进敞开大门。
感谢阅读,请随时就本文和/或随附代码发表您的意见。
历史
- 2013-03-18:初始版本。