
一个简单的图表控件
一个简单的控件,用于绘制点随时间变化的图表
引言
这里是另一个图形控件。 我不得不编写它,因为我没有找到任何其他易于使用的图形控件能够满足我的需求。 这可能就是您正在寻找的那个。 我认为代码也相当快。
此代码不是很重,您可以轻松地将其集成到您的项目中。 此代码也可以用作一个单独的模块,您可以将其链接到您自己的项目中。
Using the Code
首先,添加 using 子句
using WindowsFormsControlLibrary;
创建控件
首先要做的是创建一个控件的实例。
有三个构造函数
- 默认构造函数
public GraphControl()使用 Arial 字体,如下所示
_CurveFont = new Font("Arial", 15);
_CurveLegendFont = new Font("Arial", 10);
_AxeFont = new Font("Arial", 8);
public CurveControl(Font TitleFont, Font CurveLegendFont, Font AxeFont)
public GraphControl(Font TitleFont, Font GraphLegendFont,
			Font AxeFont, string DTFormat)
然后可以如下创建 Graph 控件
//Create a Graph Control
GraphCtrl = new GraphControl(new Font("Arial", 12),
		new Font("Arial", 10), new Font("Arial", 8));
GraphCtrl.TabIndex = 0;
GraphCtrl.Dock = DockStyle.Fill;
GraphCtrl.Name = "Graph 1";

//Add Graph Control to the form or a panel on the form
GraphPanel.Controls.Add(GraphCtrl);
添加系列
Graph 控件包含三个主要属性
- 一系列点的字典
- 主轴
- 次轴
需要添加(创建)点系列,该系列在开始时将为空。 为此,请调用 AddPointsSerie 方法
//Add series
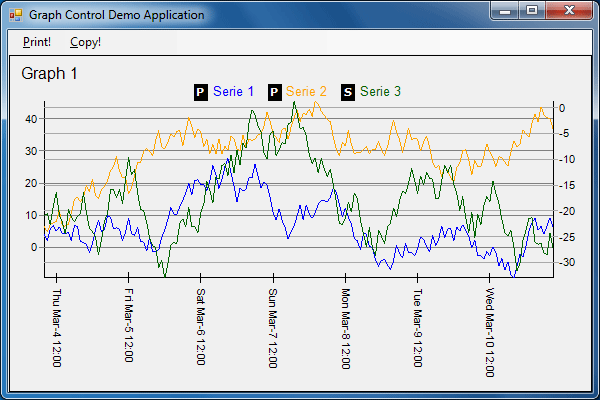
GraphCtrl.AddPointsSerie("Serie1", Axes.VerticalPrimary, "Serie 1", Color.Blue);
GraphCtrl.AddPointsSerie("Serie2", Axes.VerticalPrimary, "Serie 2", Color.Orange);
GraphCtrl.AddPointsSerie("Serie3", Axes.VerticalSecondary, "Serie 3", Color.DarkGreen);
AddPointsSerie 方法接受四个参数
- 用于标识系列的键
- 用于显示系列的垂直轴
- 系列的显示标签
- 系列的颜色
轴取自 Axes 枚举中可用的两个垂直轴。
添加点
现在需要用点填充系列。
要检索系列,请使用 GetPointsSerie 方法,然后调用三个 AddPoint 方法之一
GraphCtrl.GetPointsSerie("Serie1").AddPointD(dt.AddHours(i), y1);
三个 AddPoint 方法是
-
public void AddPointF(DateTime t, float Y)
-
public void AddPointD(DateTime t, double Y)
-
public void AddPointS(DateTime t, string Y)
添加一个 Y 值为 float 的点。
添加一个 Y 值为 double 的点。
添加一个 Y 值为以 string 形式提供的 float。如果给定的字符串无效,则忽略该点。
更新显示
如果更改了任何内容,例如向系列中添加点,您需要 Invalidate 控件
CC.Invalidate();
更改系列的轴
可能需要更改系列关联的轴。 为此,请调用 SetSerieAxe 方法
CC.SetSerieAxe("Serie2", Axes.VerticalPrimary);
清除系列
CC.GetPointsSerie("Serie2").ClearPointsArray();
删除系列
CC.RemovePointsSerie("Serie2");
打印和复制到剪贴板
可以使用新方法打印 Graph 或将 Graph 复制到剪贴板
public void DrawGraph(Graphics g, Rectangle bounds)
该方法有两个参数
- 一个 Graphics 对象
- 一个用于在其上绘制 Graph 的 Rectangle
使用该方法进行打印
private void PrintDocument1_PrintPage
	(object sender, System.Drawing.Printing.PrintPageEventArgs e)
{
   GraphCtrl.DrawGraph(e.Graphics, e.MarginBounds);
}
使用该方法复制到剪贴板
private void CopyToolStripMenuItem_Click(object sender, EventArgs e)
{
   Bitmap Bmp = new Bitmap(800, 400); Bmp.SetResolution(100, 100);
   Graphics g = Graphics.FromImage(Bmp);
   g.Clear(Color.White);
   GraphCtrl.DrawGraph(g, new Rectangle(new Point(0, 0), Bmp.Size));
   Clipboard.SetImage(Bmp);
}
Interactivity
图形显示名称
用户可以双击图形显示的名称来更改它。
系列选择
单击系列或靠近系列将选择它。
历史
- 2010 年 2 月 25 日 - 文章首次发表
- 2010 年 3 月 3 日
- 增加了在调整大小时控件重新绘制自身的功能
- 创建了一个单独的
Draw函数以允许将其用于绘图、打印、复制... - 更改了在水平轴上显示日期的默认格式,并添加了第 3 个构造函数以在需要时指定它
- 在
GraphAxe类中添加了MajorUnitDateTime,尚未被使用 - 将所有内容重命名为使用 Graph 而不是 Curve