
钻取报告编写器(带图表)
4.38/5 (7投票s)
本文介绍了一个基于模板的报表工具,支持钻取和图表功能。

引言
本文介绍了一个基于模板的报表工具,支持钻取和图表功能。生成的报表可以导出到 Excel 或 XML。它原生支持 MS-SQL Server,并通过 ODBC 支持 Oracle、MySql 等。
Using the Code
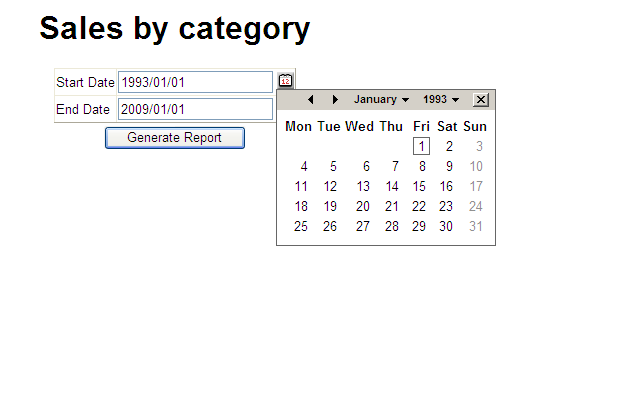
Default.aspx 向您展示了如何选择报表。基本上,您需要导航到 Reports/Reporter.aspx,并通过查询字符串参数指定要处理的报表。报表工具和所有报表模板都保存在自己的文件夹中,以便轻松将报表添加到任何现有项目中。
以下是一个示例报表模板。您提供报表的完整 HTML,因此您可以完全掌控并按需进行任何操作。最简单的方法是采用其中一个示例并进行修改以满足您的需求。形式为 @@@xxxxx@@@ 的占位符将被您指定的报表参数替换。
<html>
       <head>
    <title>Sales by category</title>
    <link id='Link2' href='Reports.css' rel='STYLESHEET' type='text/css' />
  <!-- set the css any way you want -->
  <style>
        BODY, TD
        {
            font-family: Arial;
            font-size: small;
        }
        .ReportFormatDDL
        {
            font-size: xx-small;
        }
        .rowclass_odd
        {
            background-color: gray;
        }
        .rowclass_even
        {
            background-color: lightblue;
        }
        #title
        {
            color: Green;
        }
        #subtitle
        {
            color: orange;
        }
    </style>
</head>
<body>
    <div id="title" align="center">
        Sales by category</div>
    <div id="subtitle" align="center">
<!- the parameter section below tells the reporting engine to ask for a
start and end date (into the variable @@@Start_Date@@@ and @@@End_Date,
these values are substituted in the next line -->
        (@@@Start_Date@@@ - @@@End_Date@@@)</div>
<!-- this is any old HTML you want to make your report look nice -->
    <table align="center">
        <tr>
            <td>
                <div style="width: 150px;">
                </div>
            </td>
            <td valign="center">
<!-- "chart" is a special id. The contents of this div are replaced with the chart.
Notice the "onclick" handler, this causes your drill down menu to appear.
The contents here are just a placeholder so that you can preview the report in Visual Studio.
If id "chart" exists then it must appear before id "table".
The charting div has the following named attributes:
ChartType - one of the MSChart charting types
width - width of the chart
height - height of the chart
xcol = the result set column to use for the x co-ord (origin 1)
ycol - the result set column to use for the y co-ord (origin 1) -->
                <div id="chart" ChartType="donut" width="300" height="300" xcol="2" ycol="3"
                    onclick="ShowMenuEvent(event);" style="cursor: hand;">
                    <table align="center">
                        <tr>
                            <td>
                                Chart appears here
                            </td>
                        </tr>
                    </table>
                </div>
            </td>
            <td valign="center">
<!-- Here I show you how you can embed another report inside this one.
Note that the variables @@@Start_Date@@@ and @@@End_Date@@@ are substituted
with the currrent reports values so that they will not be asked for again.
Clicking in the iframe will cause a new window to open with this report. -->
          <iframe src='Reporter.aspx?
	path=MSSQL$Sales$Manager$Sales_by_Customer_ThumbNail_en.html&
	format=html&Start_Date=@@@Start_Date@@@&End_Date=@@@End_Date@@@'
          style="width: 150px; height: 300px;" frameborder="0"
	scrolling="no" marginheight="0"
          marginwidth="0"></iframe>
            </td>
        </tr>
    </table>
<!-- "table" is a special id. Its cotents are replaced with the reports tabular data -->
    <table id="table" border="1" style="border-collapse: collapse" align="center">
        <thead>
            <tr>
                <td>
                </td>
                <td style="font-weight: bold">
                    Category
                </td>
                <td style="font-weight: bold">
                    Sales
                </td>
            </tr>
        </thead>
        <tbody>
< the first TR of the TBODY defines the template to use to display odd
numbered rows -->
<!-- the first column of the data result set must be an identity column used for drill down.
@@@1@@@ is replaced by the identity column for each row -->
            <tr class="rowclass_odd" onclick="ShowMenu(this, '@@@1@@@');"
		style="cursor: hand;">
                <td>
<!-- @@@row@@@ is a special variable containing the current row number.
You can also use it to create unique ids if you need them for some reason -->
                    @@@row@@@)
                </td>
                <td style="font-weight: bold">
<!-- column 2 of the result set is substituted here -->
                    @@@2@@@
                </td>
                <td align="right"
id="some_unique_id_@@@row@@@">
                    <b>$</b>@@@3@@@
                </td>
            </tr>
<!-- This is the template for the even numbered rows -->
            <tr class="rowclass_even" onclick="ShowMenu(this, '@@@1@@@');"
		style="cursor: hand;">
                <td>
                    @@@row@@@)
                </td>
                <td style="font-weight: bold">
                    @@@2@@@
                </td>
                <td align="right">
                    <b>$</b>@@@3@@@
                </td>
            </tr>
        </tbody>
        <tfoot>
            <tr>
                <td>
                </td>
                <td>
                    Totals
                </td>
<!-- The footer row can contain summary data for a column (like Excel).
The formula value can be: sum, count, avg. -->
                <td formula="sum">
                    <b>$</b>@@@3@@@
                </td>
            </tr>
        </tfoot>
    </table>
<!-- You can export the report to Excel or xml. -->
    <table align="center">
        <tr>
            <td>
                <select name="format" onchange="document.forms[0].submit();">
                    <option value="">Export to ...</option>
                    <option value="xls">excel</option>
                    <option value="xml">xml</option>
                </select>
            </td>
        </tr>
    </table>
<!-- This is your drill down menu -->
    <div id="menu" class="DDL_Menu" style="position: absolute; top: 300;
	left: 0; display: block;
        width: 300px" onclick="CloseMenu();" runat="server">
        <fieldset style="background-color: lightblue;">
            <legend style="color: black">Drill-down menu  </legend>
            <table id="menutable">
                <tr>
                    <td>
<!-- @@@1@@@ is substituted with the identity column of the row that the menu
has been displayed for __>
            <a style="color: black; text-decoration: none"
		onclick="return(DoDrillDown(this));"
            href="Reporter.aspx?path=MSSQL$Sales$Manager$Sales_by_
		Product_by_Specific_Category_en.html&Category=@@@1@@@"
            target="_blank">Sales by Products by Specific Category</a>
                    </td>
                </tr>
                <tr>
                    <td>
                        <a style="color: black; text-decoration: none"
			onclick="return(DoDrillDown(this));"
                            	href="Reporter.aspx?path=MSSQL$Sales$
			Manager$Sales_by_Customer_by_Specific_Category_en.html
			&Category=@@@1@@@"
                            	target="_blank">Sales by Customer by Specific Category</a>
                    </td>
                </tr>
            </table>
        </fieldset>
    </div>

    <script>
// we left the drilldown menu visible for design purposes, hide it!
        document.getElementById("menu").style.display="none";
    </script>

</body>
<div style="display: none">
<!-- These are the parameters that will be asked for when the report is run -->
    <div id="parameters">
        <parameter name="Start_Date" type="date" default="1993/01/01" />
        <parameter name="End_Date" type="date" default="2009/01/01" />
    </div>
    <div id="data">
<!-- This is the SQL that will be executed to generate the report data.
In this example I am using named parameters (@Start_Date, etc) just to show how it is done,
but you can use positional parameters (as you must for ODBC type connections) -->
        <series sql="EXEC Report$Sales$Manager$Sales_by_Category_en
	@Start_Date='@@@Start_Date@@@', @End_Date='@@@End_Date@@@'" />
    </div>
</div>
</html>
参数
参数部分允许您定义运行报表时会提示输入的参数。每个参数都有以下属性:
name- 参数的名称。显示时,所有下划线都会替换为空格,因此“Start_Date”会显示为“Start Date”。type- 参数类型。支持的值包括:date、int、bigint、money、real、float、string。droplist- 创建一个下拉列表,例如:droplist="select val, txt from table order by txt"。default- 下拉列表中默认选中的值,例如:default="some text"。
这是一个示例
<parameter name="My_List" type="string" droplist="select val,
	txt from table order by txt" default="some text" />
在提示输入参数值之前,报表引擎会尝试满足参数值:
通过将参数名称与相应的 cookie、session、表单变量或查询字符串变量(按此顺序)进行匹配。
CustomerHelpers.GetParam 包含此算法。您可以根据需要进行修改。
例如,如果您有一个多部门的网站,并且希望将登录员工可查看的数据限制在其所属部门,则创建一个名为 DepartmentId 的 cookie,并确保 DepartmentId 是存储过程或用于获取结果集的 select 语句的参数。
报表引擎将始终使用 cookie 值来满足 DepartmentId 参数。
获取其他变量
有时您可能需要更多信息。例如,您可能拥有某个类别的标识值,但需要其名称。在模板中添加以下内容(请参阅 ODBC$Sales$Manager$Sales_by_Product_by_Specific_Category_en.html)
<div id="sets">
<!-- @@@Category@@@ is a parameter to this report -->
   <set name="CategoryName" sql="select CategoryName from Categories
	where CategoryId=@@@Category@@@" />
   <set name="SomeOtherVariable" sql="EXEC SomeStoredProcedure @@@Category@@@,
	@@@SomeOherInputParamter@@" />
</div>
访问您的数据库
Web.config 包含一个 appsettings 部分,如下所示:
<appSettings>
<add key="DBType" value="ODBC"/>
<add key="MSSQLConnStr" value="Data Source=DRYDEN-D6A544AB\SQLEXPRESS;
	Initial Catalog=NorthWind;User Id=sa;Password=pwd;"/>
<add key="ODBCConnStr" value="DSN=NorthwindODBC;Uid=sa;Pwd=pwd;"/>
</appSettings>
选择 DBType 为“ODBC”或“MSSQL”,并设置相应的连接字符串。
文件夹 (SPs) 中的示例存储过程在 Northwind 数据库上运行,该数据库不包含在 zip 文件中,但可以从 这里 下载。
添加对其他数据库类型的原生支持
文件 DBMsSql.cs 和 DBOdbc.cs 很好地展示了您需要编写多少代码才能原生支持任何具有 .NET 提供程序的数据库。
安全
CustomerHelpers.cs 包含一个名为 CanAccess 的 static 方法。它有一个参数,即正在运行的报表的文件名。您可能需要使用 cookie、session 变量和登录信息来确定用户是否被允许运行指定的报表。
如果报表可以运行,则返回 true,否则返回 false。
提示:如果您的报表命名如下:Report$Department$Role$ReportName_Language.html,则可以使用 cookie 和 session 变量来确定登录用户是否应该能够运行指定的报表。
语言
如果您在报表名称后添加一个两位数的语言代码,例如:
Reports/ODBC$Sales$Manager$Sales_by_Customer_by_Specific_Category_en.html
Reports/ODBC$Sales$Manager$Sales_by_Customer_by_Specific_Category_fr.html
那么报表参数和列标题可以针对特定语言进行定制。
图表
图表是使用可免费下载的 MSChart.exe 和 MSChart_VisualStudioAddOn.exe 构建的。
请参阅 本文 开始学习图表。我建议您在尝试在报表引擎中使用图表之前,先构建自己的图表项目,因为要正确安装和使用图表需要一些学习过程。
缩略图
在上面提供的示例中,第二个图表位于一个 iframe 中,当您单击它时,它会在另一个窗口中展开。
之所以能够展开,是因为 iframe 中的图表 div 包含一个 onclick 处理程序
(请参阅 ODBC$Sales$Manager$Sales_by_Customer_Thumbnail_en.html),该处理程序实际上会打开一个带有不同报表的新窗口(请参阅 ODBC$Sales$Manager$Sales_by_Customer_en.html)。
结论
希望您喜欢使用这个报表工具。如果您有任何改进建议,请与我联系。如果您进行了任何更改(例如:添加了新的公式类型或添加了新的原生数据库提供程序),请将其发送给我,我将将其集成到源代码中(并将所有署名权归您!)。
历史
- 2010年2月25日:初始版本