
Visual Basic 10GDI+Visual Basic 9 (2008)Visual Basic 8 (2005)Visual Studio 2008.NET 3.0Visual Studio 2005Visual Studio 2010.NET4.NET 2.0.NET 3.5中级开发Visual Studio.NETVisual Basic
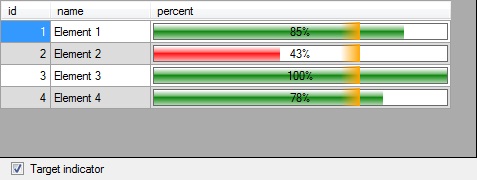
DataGridView 中的条形图
4.79/5 (39投票s)
如何在 DataGridView 中显示条形图
引言
有时,以图形方式显示 DataGridView 中一列的值对用户来说很有用,以便轻松比较行。这是一个通过仅从 DataGridView 的 CellPainting 事件调用共享类方法来实现此功能的示例,正如我在我的博客 http://ensamblareficiente.blogspot.com (西班牙语) 中描述的那样。
Using the Code
该项目以简单的方式展示了如何使屏幕截图网格正常工作。
这是基于我们是否要显示目标指示器(CheckBox1 的状态告诉我们这一点)调用的方法
Private Sub DataGridView1_CellPainting(ByVal sender As Object, _
        ByVal e As System.Windows.Forms.DataGridViewCellPaintingEventArgs) _
        Handles DataGridView1.CellPainting
    '   Avoids rows or columns out of data area
    If e.RowIndex < 0 OrElse e.ColumnIndex < 0 Then Exit Sub

    '   Checks if it's painting percent column
    If e.ColumnIndex <> Columns.Percent Then Exit Sub

    '   Get data row
    Dim oRow As DataSet1.DataRow = _
        DirectCast(DataGridView1.Rows(e.RowIndex).DataBoundItem, DataRowView).Row

    '   Tells to DataGridView that we will take care of painting cell
    e.Handled = True

    '   Selects bar color based on percent value.
    Dim oColor As Drawing.Color = Color.Green
    If CheckBox1.Checked AndAlso oRow.percent < _ciTarget Then oColor = Color.Red

    '   Draws cell with bar
    If CheckBox1.Checked Then
        Bar.PintaDegradado(oColor, e, oRow.percent, _ciTarget, Color.Orange)
    Else
        Bar.PintaDegradado(oColor, e, oRow.percent)
    End If
End Sub
这是 bar 类的代码
''' <summary>
''' Draws a bar in a DatGridView cell.
''' </summary>
''' <remarks></remarks>
Public Class Bar

    ''' <summary>
    ''' Draws a glass bar into a cell
    ''' </summary>
    ''' <param name="oColor">Color of the bar.</param>
    ''' <param name="e">CellPainting event's parameters</param>
    ''' <remarks></remarks>
    Public Shared Sub PintaDegradado(ByVal oColor As Drawing.Color, _
                  ByVal e As DataGridViewCellPaintingEventArgs)
        Bar.PintaDegradado(oColor, e, -1)
    End Sub

    ''' <summary>
    ''' Draws a partial glass bar into a cell
    ''' </summary>
    ''' <param name="oColor">Color of the bar.</param>
    ''' <param name="e">CellPainting event's parameters</param>
    ''' <param name="iPorcentaje">Percent value to represent.</param>
    ''' <remarks></remarks>
    Public Shared Sub PintaDegradado(ByVal oColor As Drawing.Color, _
           ByVal e As DataGridViewCellPaintingEventArgs, ByVal iPorcentaje As Integer)
        Dim aCol As Drawing.Color() = {oColor}
        Dim aPor As Integer() = {iPorcentaje}
        If iPorcentaje = -1 Then
            Dim aPorN As Integer() = {}
            Bar.PintaDegradado(aCol, e, aPorN)
        Else
            Bar.PintaDegradado(aCol, e, aPor)
        End If
    End Sub

    ''' <summary>
    ''' Draws a partial glass bar into a cell with target indicator.
    ''' </summary>
    ''' <param name="oColor">Color of the bar.</param>
    ''' <param name="e">CellPainting event's parameters</param>
    ''' <param name="iPorcentaje">Percent value to represent.</param>
    ''' <param name="iObjetivo">Target to show.</param>
    ''' <param name="oColorObjetivo">Target indicator color.</param>
    ''' <remarks></remarks>
    Public Shared Sub PintaDegradado(ByVal oColor As Drawing.Color, _
           ByVal e As DataGridViewCellPaintingEventArgs, ByVal iPorcentaje As Integer, _
           ByVal iObjetivo As Integer, ByVal oColorObjetivo As Drawing.Color)
        Dim aCol As Drawing.Color() = {oColor, oColorObjetivo}
        Dim aPor As Integer() = {iPorcentaje, iObjetivo}
        Bar.PintaDegradado(aCol, e, aPor)
    End Sub

    ''' <summary>
    ''' Does the hard job
    ''' </summary>
    ''' <param name="aColores">Color array to use.</param>
    ''' <param name="e">CellPainting event's parameters</param>
    ''' <param name="aPorcentajes">Percent array to show. It can be one or two.
    ''' First shows bar percent and second shows target percent.
    ''' If only one percent is passed and it's cero,
    ''' it will fill all cell width with the glass bar.</param>
    ''' <remarks></remarks>
    Private Shared Sub PintaDegradado(ByVal aColores As Drawing.Color(), _
	ByVal e As DataGridViewCellPaintingEventArgs, ByVal aPorcentajes As Integer())

        '   Declares brushes and color array
        Dim oPin1 As Drawing2D.LinearGradientBrush = Nothing
        Dim oPin2 As Drawing2D.LinearGradientBrush = Nothing
        Dim oPinO As Drawing2D.LinearGradientBrush = Nothing
        Dim oColor As Drawing.Color = aColores(0)

        '   Handles any exception
        Try
            '   Gets cell rectangle
            Dim oCelda As New Rectangle(e.CellBounds.X - 1, e.CellBounds.Y - 1, _
		e.CellBounds.Width, e.CellBounds.Height)

            '   Debugs percent array
            For iC As Integer = 0 To aPorcentajes.Length - 1
                If aPorcentajes(iC) > 100 Then aPorcentajes(iC) = 100
            Next

            '   Declares rectangles.
            Dim oRect1 As Rectangle             ' Glass upper rect.
            Dim oRect2 As Rectangle             ' Glass lower rect.
            Dim oObj As Rectangle               ' Target rect.
            Dim oFond As Rectangle              ' Background rect.
            Dim oCuad As Rectangle = Nothing    ' Border rect.

            '   Declares percent variable
            Dim iPorcentaje As Integer = 0
            Dim bPor As Boolean = False

            '   Detects if percent(s) is/are passed
            '   One percent indicates only value percent.
            '   Two percents indicate value and target percent.
            If aPorcentajes.Length > 0 Then
                bPor = True
                iPorcentaje = aPorcentajes(0)

                If iPorcentaje > 0 Then

                    '   Gets rectangles and brushes for percent indicator.
                    oRect1 = New Rectangle(oCelda.X + 4, oCelda.Y + 4, _
			Math.Round(((oCelda.Width - 7) * iPorcentaje * 0.01) + 0.49),_
			 Math.Round((oCelda.Height - 8) / 2))
                    If oRect1.Width > oCelda.Width - 7 _
			Then oRect1.Width = oCelda.Width - 7
                    oRect2 = New Rectangle(oCelda.X + 4, oRect1.Bottom - 1, _
			oRect1.Width, (oCelda.Height - 6) - oRect1.Height)
                    oFond = New Rectangle(oCelda.X + 4, oCelda.Y + 4, _
			oCelda.Width - 7, oCelda.Height - 7)
                    oPin1 = New Drawing2D.LinearGradientBrush(oRect1, _
			Color.White, Color.FromArgb(180, oColor), _
			Drawing2D.LinearGradientMode.Vertical)
                    oPin2 = New Drawing2D.LinearGradientBrush(oRect2, _
			oColor, Color.FromArgb(70, oColor), _
			Drawing2D.LinearGradientMode.Vertical)
                End If

                If aPorcentajes.Length > 1 Then

                    '   Get rectangles and brushes for target indicator
                    Dim iObj As Integer = aPorcentajes(1)
                    Dim iPos As Integer = oCelda.X + 4 + Math.Round_
			(((oCelda.Width - 7) * iObj * 0.01) + 0.49)
                    Dim iIni As Integer = iPos - 20
                    If iIni < oCelda.X + 4 Then iIni = oCelda.X + 4
                    oObj = New Rectangle(iIni, oCelda.Y + 2, iPos - iIni, _
			oCelda.Height - 4)
                    oPinO = New Drawing2D.LinearGradientBrush(oObj, _
			Drawing.Color.FromArgb(0, aColores(1)), aColores(1), _
			Drawing2D.LinearGradientMode.Horizontal)
                End If

                '   Get border rectangle
                oCuad = New Rectangle(oCelda.X + 3, oCelda.Y + 3, oCelda.Width - 6, _
			oCelda.Height - 6)
            Else

                '   Gets rectangles and brushes to fill cell (no percents)
                oRect1 = New Rectangle(oCelda.X + 1, oCelda.Y + 1, _
			oCelda.Width - 1, Math.Round(oCelda.Height / 2))
                oRect2 = New Rectangle(oCelda.X + 1, oRect1.Bottom - 1, _
			oCelda.Width - 1, oCelda.Height - oRect1.Height)
                oFond = New Rectangle(oCelda.X + 1, oCelda.Y + 1, _
			oCelda.Width - 1, oCelda.Height)
                oPin1 = New Drawing2D.LinearGradientBrush(oRect1, _
			Color.White, Color.FromArgb(180, oColor), _
			Drawing2D.LinearGradientMode.Vertical)
                oPin2 = New Drawing2D.LinearGradientBrush(oRect2, _
			oColor, Color.FromArgb(70, oColor), _
			Drawing2D.LinearGradientMode.Vertical)

            End If

            '   Paints cell background
            e.PaintBackground(e.CellBounds, True)
            If bPor Then
                e.Graphics.DrawRectangle(Pens.DimGray, oCuad)
            End If

            '   Paints glass bar
            If oPin1 IsNot Nothing Then
                e.Graphics.FillRectangle(Brushes.White, oFond)
                e.Graphics.FillRectangle(oPin1, oRect1)
                e.Graphics.FillRectangle(oPin2, oRect2)
            End If

            '   Paints target indicator
            If oPinO IsNot Nothing Then
                e.Graphics.FillRectangle(oPinO, oObj)
            End If

            '   Paints cell contents
            e.PaintContent(oCelda)
            e.Paint(oCelda, DataGridViewPaintParts.Border)
            e.Handled = True
        Catch ex As Exception
            Debug.Print(ex.Message)
        Finally

            '   Dispose all resources
            If oPin1 IsNot Nothing Then
                oPin1.Dispose()
                oPin1 = Nothing
            End If
            If oPin2 IsNot Nothing Then
                oPin2.Dispose()
                oPin2 = Nothing
            End If
            If oPinO IsNot Nothing Then
                oPinO.Dispose()
                oPinO = Nothing
            End If
        End Try
    End Sub

End Class
关注点
这段代码展示了如何绘制玻璃效果条:两个渐变矩形就完成了这项工作。它还展示了如何处理 DataGridView 的单元格绘制操作。这些条形图是动态绘制的,因此实时数据更新会实时显示。这允许显示实时进度条。
历史
- 2010 年 6 月 4 日:原始版本
- 2010 年 8 月 24 日:文章已更新