
使用 MapWinGIS 和 C# 构建桌面 GIS 应用程序 - 第二部分
4.98/5 (43投票s)
是时候提高您的符号学技能,并为您的地图添加标签了。
介绍
本系列教程的目的是提供一种简单易用的方法来开发桌面 GIS 应用程序。我的工具包只包含 MapWindow GIS 项目的 MapWinGIS.ocx,这是 Windows 平台上最成功的开源 GIS 项目之一。MapWinGIS.ocx 提供了维护和显示 GIS 数据的全套工具,并且在 MPL 许可下免费使用。
在上一课中,我们讨论了在 MapWinGIS.ocx 地图控件上显示 GIS 数据所需的基础知识。我们还讨论了如何自定义显示 GIS 数据的符号。在本课中,我将教你如何提高你的符号技巧,并在你的地图上使用标注功能。
如前一课所述,我在随附的代码中使用了 .NET Framework 3.5 和 Visual Studio 2008 professional 版本,但你可以使用 Visual Studio express 版本获得相同的结果。你还需要下载 MapWinGIS.ocx 并在你的机器上安装它。你可以从 MapWindow 项目的官方网站下载。
属性和符号
GIS 最令人惊叹的特性之一是将地理实体的描述与其几何形状结合起来。事实上,每个地理实体都可以使用不同的属性来描述。例如,地块的属性可能包括面积、周长、所有者姓名、土地用途等。这些属性可以用来使用不同的符号方法创建不同的地图。在前一课中,我们使用了简单的符号方法,其中 GIS 图层中的所有要素都显示为单个符号。在本课中,我们将了解如何使用属性数据创建定量地图。
根据 ESRI 于 1998 年 7 月发布的 ESRI Shapefile 规范,“Shapefile”技术上是指具有相同名称和不同扩展名的三个文件
- *.shp 是包含地理实体几何表示的主要文件
- *.shx 是索引文件,以及
- *.dbf 是属性文件
ESRI Shapefile 使用 Dbase IV DBF 文件格式来存储 GIS 图层的属性。本课随附的数据是一个单一的 ESRI Shapefile,表示阿拉伯联盟国家。该 shapefile 的属性分为两个字段:CNTRY_NAME 和 POP_CNTRY。CNTRY_NAME 是一个文本字段,包含国家名称。POP_CNTRY 是一个无符号长整型字段,包含国家人口。
创建你的 GUI
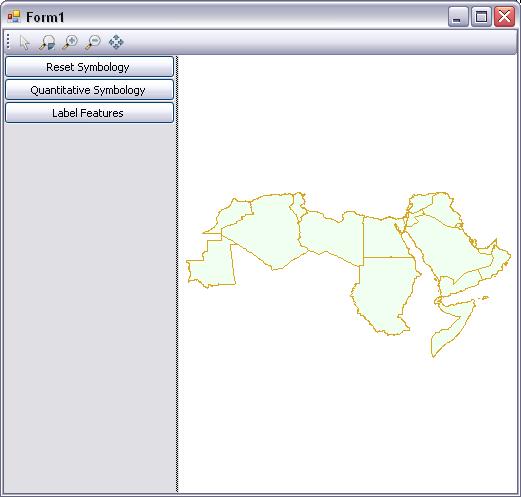
我们的应用程序的 GUI 由一个 Windows 窗体组成。该窗体有一个名为 toolStrip1 的工具条,其中包含五个按钮:toolCursor、toolZoomExtent、toolZoomIn、toolZoomOut 和 toolPan。这些按钮的代码在前一课中已讨论。该窗体有一个名为 splitContainer1 的分割容器,它垂直分为两个面板:左侧为 splitContainer1.panel1,右侧为 splitContainer1.panel2。左侧面板包含三个按钮:btnReset、btnQuant 和 btnLablel。右侧面板包含 MapWinGIS.ocx 地图控件组件,名为 axMap1。你还已将 MapWinGIS.ocx 的引用添加到你的项目中。前一课包含了添加引用的详细步骤。
下图显示了本课随附的应用程序的 GUI
设置你的公共变量
在此应用程序中,我使用了两个 public 变量。第一个是一个整数,表示图层句柄,第二个是 MapWinGIS.Shapefile。这些变量将在类声明的第一个子句之后直接声明,如下所示
//Create a layer handler
public int intHandler;
//Create a new instance for MapWinGIS.Shapefile
public MapWinGIS.Shapefile myShapefile = new MapWinGIS.Shapefile();
这些项应该是 public 的,因为许多方法将使用这些项。
创建 SetBasicSymbology 方法
此方法的目标是每次调用时将图层的符号设置为预定义的特定符号。它不返回值。以下代码显示了此方法
public void SetBasicSymbology()
{
    //Set Filling color of the polygon shapefile
    axMap1.set_ShapeLayerFillColor(intHandler,
	(UInt32)(System.Drawing.ColorTranslator.ToOle(System.Drawing.Color.Honeydew)));
    //Set the outline color of the polygon features
    axMap1 .set_ShapeLayerLineColor(intHandler,
	(UInt32)(System.Drawing.ColorTranslator.ToOle(System.Drawing.Color.Goldenrod)));
}
加载你的数据
现在,我们将把数据加载到我们的窗体中,以下代码应添加到 Form1_Load 事件中
private void Form1_Load(object sender, EventArgs e)
{
   //Define the data source of Shapefile instance
   myShapefile.Open(@"D:\GISSampleData2\arabcntry.shp", null);
   //Display the layer on the map control
   intHandler = axMap1.AddLayer(myShapefile, true);

   SetBasicSymbology();
}
此代码将 shapefile (D:\GISSampleData2\arabcntry.shp) 加载到 MapWinGIS.Shapefile 实例 (myShapefile) 中,然后将其添加到地图控件 (axMap1) 并将其句柄存储在 intHandler 中。最后,我们将调用 SetBasicSymbology() 来设置图层的基本符号。
btnReset 代码
btnReset 的目标是每次用户单击它时将图层的符号重置为基本符号。btnReset 的代码如下:
private void btnReset_Click(object sender, EventArgs e)
{
   SetBasicSymbology();
}
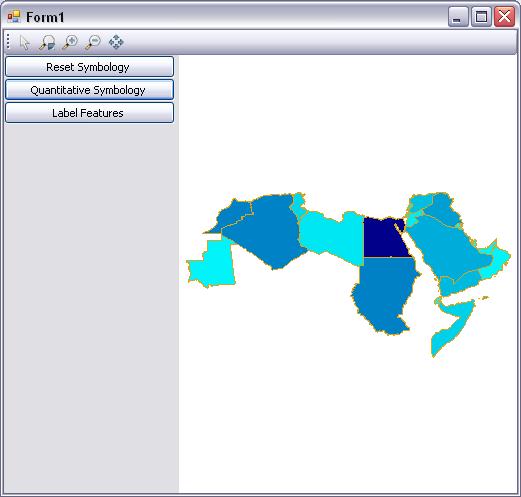
btnQuant 代码
btnQUnat 的代码是本课的主要目标。此代码自定义图层符号,以使用两种颜色的渐变显示每个国家的人口。第一种颜色是 Aqua 色,表示人口较少的国家;另一种颜色是深蓝色,表示人口最多的国家。任何人口介于最少和最多之间的人口国家都将以 Aqua 和深蓝色之间的颜色着色。
要做到这一点,你需要知道 shapefile 表中的哪个字段包含人口,并计算最小和最大人口。
代码将添加到 btnQuant_Click 事件中,让用户点击此按钮并创建他们的定量地图,显示阿拉伯联盟国家的人口。
代码如下
private void btnQuant_Click(object sender, EventArgs e)
        {
            //Create a new instance for MapWinGIS.Table
            MapWinGIS.Table myTable = new MapWinGIS.Table();
            //Define the data source of Table instance
            myTable.Open(@"D:\GISSampleData2\arabcntry.dbf", null);
            //Define the index of the field will used in symbology
            int myFieldIndex = 1;
            //Get the number of rows in the table
            int numberOfRows = myTable.NumRows;
            //Create an array to store the cell values of the field
            double[] myCellsValues = new double[numberOfRows];
            //Populate the array with cell values restored from the Table instance
            for (int i = 0; i < numberOfRows - 1; i++)
            {
                myCellsValues[i] =
                    System.Convert.ToDouble(myTable.get_CellValue(1, i));
            }
            //Get the minimum and maximum values
            double minValue = myCellsValues.Min();
            double maxValue = myCellsValues.Max();

            //Create a new instance for MapWinGIS.ShapefileColorScheme
            MapWinGIS.ShapefileColorScheme myScheme =
				new MapWinGIS.ShapefileColorScheme();
            //Set the layer handler to the MapWinGIS.ShapefileColorScheme instance
            myScheme.LayerHandle = intHandler;
            //Set the field index to use in symbology
            myScheme.FieldIndex = myFieldIndex;
            //Create a new instance for MapWinGIS.ShapefileColorBreak
            MapWinGIS.ShapefileColorBreak myBreak =
			new MapWinGIS.ShapefileColorBreak();
            //Set the minimum value in the field as a start value
            myBreak.StartValue = minValue;
            //Set the start color of the scheme
            myBreak.StartColor =
                (UInt32)(System.Drawing.ColorTranslator.ToOle
		(System.Drawing.Color.Aqua));
            //Set the maximum value in the field as an end value
            myBreak.EndValue = maxValue;
            //Set the end color of the scheme
            myBreak.EndColor =
                (UInt32)(System.Drawing.ColorTranslator.ToOle
				(System.Drawing.Color.DarkBlue));
            //Add the break to the color scheme
            myScheme.Add(myBreak);
            //Upgrade display using the scheme
            axMap1.ApplyLegendColors(myScheme);
        }
第一行,我们声明并初始化了一个新的 MapWinGIS.Table 类实例,并将其命名为 myTable。此类旨在表示 ESRI Shapefile 的表。此类实例包含 Field 类的实例集合。每个 Field 实例用于表示 shapefile 表中的一个字段。实例具有零基索引。每个 Field 实例都有一个 CellValue 类的实例集合。CellValue 实例表示在 Field 实例中组织的单元格值。
第二行,我们使用 Open 方法将我们的 dbf 表加载到 MapWinGIS.Table 实例 (myTable) 中。
第三行,我们声明一个整数 (myFieldIndex) 并为其赋值 1。此整数用于标识我们在符号中使用的字段,作为第二个字段 (POP_ CNTRY)。
第四行使用 MapWinGIS.Table 实例 (myTable) 的 NumRows 方法获取表中的行数。
第五行,我们声明并创建了一个由 double 类型元素组成的数组 (myCellsValues),其数量等于表中的行数。
现在,我们将使用 For 循环来用 CellValue 实例在 myTable 中的值填充我们的新数组 (myCellsValues)。然后,我们将使用数组的 Min 和 Max 方法获取数组中的最小值和最大值。
最小值和最大值被赋给两个 double 类型的变量 minValue 和 maxValue。
现在,我们将声明并创建一个新的 MapWinGIS.ShapefileColorScheme 类实例,并将其命名为 myScheme。此类旨在根据存储在 shapefile 表字段中的值来描述图层的复杂颜色方案。该方案通过图层的句柄与特定图层关联,并通过字段索引与字段关联。此类实例包含 MapWinGIS.ShapefileColorBreak 实例的集合。
MapWinGIS.ShapefileColorBreak 类用于描述一个颜色主题,该主题用于根据值范围为图层中的地理实体着色。这个值范围由每个 MapWinGIS.ShapefileColorBreak 实例的两个属性限制:StartValue 和 EndValue。主题的颜色由实例的另外两个属性确定:StartColor 和 EndColor。
在此应用程序中,我使用了一个 MapWinGIS.ShapefileColorBreak 实例,名为 myBreak,并将 minValue 和 maxValue 分别赋给了 StartValue 和 EndValue 属性。此外,我还将 Aqua 色和深蓝色分别赋给了 StartColor 和 EndColor 属性。
在分配完 MapWinGIS.ShapefileColorBreak 实例 (myBreak) 的属性后,我使用 Add 方法将其添加到 myScheme 的 MapWinGIS.ShapefileColorBreak 实例集合中。
最后一步是使用地图控件 (axMap1) 的 ApplyLegendColors 方法来使用此方案对图层进行符号化。
现在,按 F5 运行应用程序,然后单击 btnQuant 按钮以获得你的新地图。
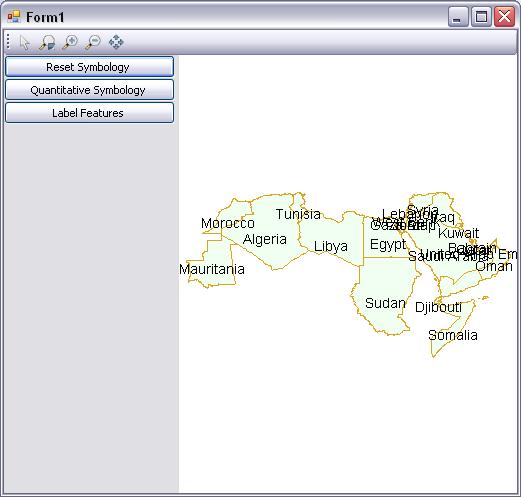
为你的地图添加标注
标注对于使你的地图有意义非常重要。大多数 GIS 用户和开发人员都使用表中存储的值来标注他们的要素,这正是我打算做的。将以下代码添加到 btnLabel_Click 事件中
private void btnLabel_Click(object sender, EventArgs e)
        {
            //Define a string to store the label of the feature
            string myLabel;
            //define two double variables to use as a coordinates for label position
            double x, y;
            //Use a loop to read the cell value that is used as a label and
	   //set the label on the map
            for (int i = 0; i < myShapefile.NumShapes -1; i++)
            {
                //assign the value of the cells of the field number zero to the label
                myLabel = System.Convert.ToString(
                    myShapefile.get_CellValue(0, i));
                //Calculate the x position for the label
                x = myShapefile.get_Shape(i).Extents.xMin +
                    (myShapefile.get_Shape(i).Extents.xMax -
			myShapefile.get_Shape(i).Extents.xMin) / 2;
                //Calculate the y position for the label
                y = myShapefile.get_Shape(i).Extents.yMin +
                    (myShapefile.get_Shape(i).Extents.yMax -
			myShapefile.get_Shape(i).Extents.yMin) / 2;
                //add the label on the map
                axMap1.AddLabel(
                    intHandler, //Layer handler
                    myLabel, //Label string
                    (UInt32)(System.Drawing.ColorTranslator.ToOle
                        (System.Drawing.Color.Black)), //Color of the label
                        x, y, //Position of the label
                        MapWinGIS.tkHJustification.hjCenter //Justification of the label
                        );
            }
        }
要为你的地图添加标注,你需要知道哪个字段包含标注值,以及将在哪里设置标注。
在之前的代码中,我创建了一个名为 myLabel 的 string 变量和两个 double 变量 x 和 y,用于在地图上定位标注。然后,我使用了 for 循环来读取 shapefile 中所有要素的第一个字段的单元格值,并在每次循环中将此值赋给 (myLabel) string 变量,并将标注位置设置为要素的中心。
最后,我使用地图控件 (axMap1) 的 AddLabel 方法,以黑色作为字体颜色,在由 x 和 y 标识的位置添加此标注 (myLabel)。
现在,按 F5 运行应用程序,然后单击 btnLabel 以在你的地图上显示标注。
现在,我们有许多有用的想法来使用 MapWinGIS.ocx 构建 GIS 应用程序。在下一课中,我们将一起探讨航空照片和卫星图像对我们的应用程序有多么有用。
历史
- 版本 1:2009 年 7 月 16 日星期四