
使用 EPPlus 在 C#.Net 中创建/读取/编辑高级 Excel 2007/2010 报表
4.85/5 (46投票s)
导出高级 Excel 2007 报表
- 下载当前版本演示 - 4.9 KB
- 下载当前版本源码 - 265.8 KB
- 下载 EPPlus_3.1.3.zip - 295.9 KB
- 下载上一版本源码 - 314.7 KB
- 下载上一版本演示 - 8.5 KB
目录
- 引言
- 要求
- 安装
- 将仅包含文本和数字的简单 Excel 工作表读取到 DataTable 中
- 设置 Excel 工作簿属性
- 合并 Excel 列
- 设置 Excel 单元格背景色
- 设置 Excel 单元格边框
- 设置 Excel 公式
- 在 Excel 单元格中添加注释
- 在 Excel 工作表中添加图片
- 在 Excel 工作表中添加自定义对象
- 从现有 Excel 工作表或模板创建新的 Excel 工作表
- 在 Excel 单元格中添加“R1C1”公式
- 在 Excel 工作表中添加“命名范围”
- 在 Excel 工作表中添加饼图
- 声明
- 历史
要使用 EPPlus 库完成一些基本的 Excel 操作,请参阅此处。
本次发布新增了以下 4 项内容
引言
最近我一直在寻找一个高级工具来生成复杂的 Excel 报表。在研究了许多工具后,我找到了 EP Plus。更多详情请参阅此链接。通过这个工具,我们可以轻松创建带有图表、图形和其他绘图对象的报表。我计划与社区分享一些示例,以便任何有兴趣使用此库的人都能获得良好的开端。
要求
- 要编译该库,您需要 C# 2010 编译器或更高版本,例如 Visual Studio 2010 或 Visual C# 2010 Express Edition。
- 要运行库代码,您需要安装 .NET 4.0 框架。
安装
- 只需安装NuGet 包。
或者,您可以从上面的链接下载库 DLL。然后执行以下操作
- 通过添加对库 DLL 的引用,将以下库添加到您的项目中。
- 添加引用后,您将在 Visual Studio 的“解决方案资源管理器”窗口中看到以下景象

- 然后,在您的 C# 文件中按以下方式添加这些命名空间
/* To work eith EPPlus library */
using OfficeOpenXml;
using OfficeOpenXml.Drawing;

/* For I/O purpose */
using System.IO;

/* For Diagnostics */
using System.Diagnostics;
快速入门
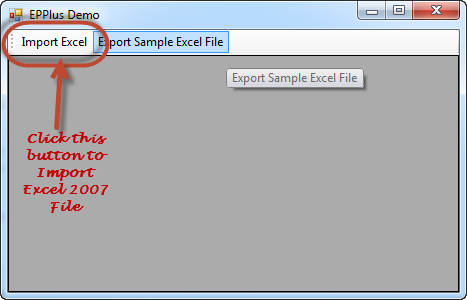
1. 从 Excel 工作表读取到 DataTable
将包含文本和数字的简单 Excel 工作表读取到 DataTable 中。
private DataTable WorksheetToDataTable(ExcelWorksheet oSheet)
{
	int totalRows = oSheet.Dimension.End.Row;
	int totalCols = oSheet.Dimension.End.Column;
	DataTable dt = new DataTable(oSheet.Name);
	DataRow dr = null;
	for (int i = 1; i <= totalRows; i++)
	{
		if (i > 1) dr = dt.Rows.Add();
		for (int j = 1; j <= totalCols; j++)
		{
			if (i == 1)
				dt.Columns.Add(oSheet.Cells[i, j].Value.ToString());
			else
				dr[j - 1] = oSheet.Cells[i, j].Value.ToString();
		}
	}
	return dt;
}
您在此项目中是如何实现的?

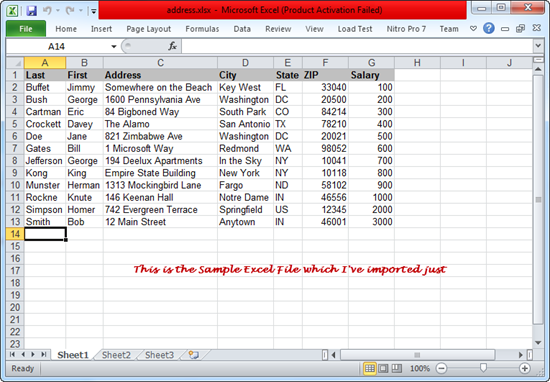
示例 Excel 文件如下
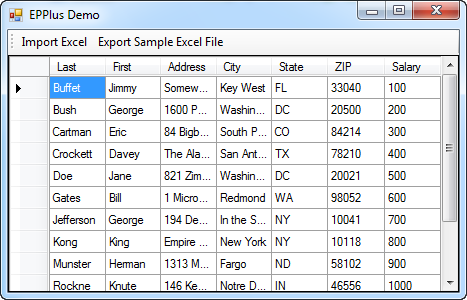
最终结果如下
2. 设置 Excel 工作簿属性
您可以设置的有用属性有
- 通过“Application”属性设置应用程序名称。
- 通过“AppVersion”属性设置应用程序版本。
- 通过“Author”属性设置作者姓名。
- 通过“Category”属性设置工作簿的类别。
- 通过“Comments”属性设置工作簿的注释。
- 通过“Company”属性设置公司名称。
- 通过“LastModifiedBy”属性设置工作簿的最后修改者。
- 通过“LastPrinted”属性设置工作簿的最后打印日期。
- 通过“Keywords”属性设置工作簿的关键字(如果有)。
- 通过“Status”属性设置工作簿的状态。
- 通过“Subject”属性设置工作簿的主题。
- 通过“Title”属性设置工作簿的标题。
您可以通过以下方式设置属性
using (ExcelPackage excelPkg = new ExcelPackage())
{
	excelPkg.Workbook.Properties.Author = "Debopam Pal";
	excelPkg.Workbook.Properties.Title = "EPPlus Sample";
}
3. 合并 Excel 列
通过提供起始单元格和结束单元格的行索引和列索引来合并 Excel 单元格。语法是:Cell[fromRow, fromCol, toRow, toCol]。您可以通过以下方式合并 Excel 单元格
//Merge Excel Columns: Merging cells and create a center heading for our table
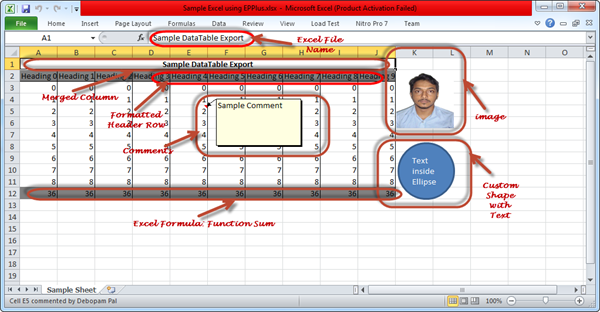
oSheet.Cells[1, 1].Value = "Sample DataTable Export";
oSheet.Cells[1, 1, 1, dt.Columns.Count].Merge = true;
4. 设置 Excel 单元格背景色和填充样式
以下填充样式可在 OfficeOpenXml.Style.ExcelFillStyle 中找到
- DarkDown
- DarkGrey
- DarkGrid
- DarkHorizontal
- DarkTrellis
- DarkUp
- DarkVertical
- Gray0625
- Gray125
- LightDown
- LightGrey
- LightHorizontal
- LightTrellis
- LightUp
- LightVertical
- MediumGrey
- 无
- 实线
您可以使用 System.Drawing.Color 中的任何颜色作为背景色。您可以通过以下方式设置背景色和填充样式
var cell = oSheet.Cells[rowIndex, colIndex];

//Setting the background color of header cells to Gray
var fill = cell.Style.Fill;
fill.PatternType = OfficeOpenXml.Style.ExcelFillStyle.Solid;
fill.BackgroundColor.SetColor(Color.Gray);
5. 设置 Excel 单元格边框
以下边框样式可在 OfficeOpenXml.Style.ExcelBorderStyle 中找到
- DashDot
- DashDotDot
- Dashed
- Dotted
- 双精度浮点型
- Hair
- 媒体
- MediumDashDot
- MediumDashDotDot
- MediumDashed
- 无
- Thick
- Thin
您可以通过以下方式设置单元格的边框样式
var cell = oSheet.Cells[rowIndex, colIndex];

//Setting top,left,right,bottom border of header cells
var border = cell.Style.Border;
border.Top.Style = border.Left.Style = border.Bottom.Style = border.Right.Style = OfficeOpenXml.Style.ExcelBorderStyle.Thin;
6. 设置 Excel 公式
var cell = oSheet.Cells[rowIndex, colIndex];

//Setting Sum Formula for each cell
// Usage: Sum(From_Addres:To_Address)
// e.g. - Sum(A3:A6) -> Sums the value of Column 'A' From Row 3 to Row 6
cell.Formula = "Sum(" + oSheet.Cells[3, colIndex].Address + ":" + oSheet.Cells[rowIndex - 1, colIndex].Address + ")";
7. 在 Excel 单元格中添加注释
///

/// Adding custom comment in specified cell of specified excel sheet
///
///
The ExcelWorksheet object
/// The row number of the cell where comment will put
/// The column number of the cell where comment will put
/// The comment text
/// The author name
private void AddComment(ExcelWorksheet oSheet, int rowIndex, int colIndex, string comment, string author)
{
	// Adding a comment to a Cell
	oSheet.Cells[rowIndex, colIndex].AddComment(comment, author);
}
8. 在 Excel 工作表中添加图片
///

/// Adding custom image in spcified cell of specified excel sheet
///
///
The ExcelWorksheet object
/// The row number of the cell where the image will put
/// The column number of the cell where the image will put
/// The path of the image file
private void AddImage(ExcelWorksheet oSheet, int rowIndex, int colIndex, string imagePath)
{
	Bitmap image = new Bitmap(imagePath);
	ExcelPicture excelImage = null;
	if (image != null)
	{
		excelImage = oSheet.Drawings.AddPicture("Debopam Pal", image);
		excelImage.From.Column = colIndex;
		excelImage.From.Row = rowIndex;
		excelImage.SetSize(100, 100);
		// 2x2 px space for better alignment
		excelImage.From.ColumnOff = Pixel2MTU(2);
		excelImage.From.RowOff = Pixel2MTU(2);
	}
}

public int Pixel2MTU(int pixels)
{
	int mtus = pixels * 9525;
	return mtus;
}
9. 在 Excel 工作表中添加自定义对象
所有形状都可以在 enum eShapeStyle 中找到。我们可以通过以下方式创建指定形状的对象并在其中插入文本。
///

/// Adding custom shape or object in specifed cell of specified excel sheet
///
///
The ExcelWorksheet object
/// The row number of the cell where the object will put
/// The column number of the cell where the object will put
/// The style of the shape of the object
/// Text inside the object
private void AddCustomObject(ExcelWorksheet oSheet, int rowIndex, int colIndex, eShapeStyle shapeStyle, string text)
{
	ExcelShape excelShape = oSheet.Drawings.AddShape("Custom Object", shapeStyle);
	excelShape.From.Column = colIndex;
	excelShape.From.Row = rowIndex;
	excelShape.SetSize(100, 100);
	// 5x5 px space for better alignment
	excelShape.From.RowOff = Pixel2MTU(5);
	excelShape.From.ColumnOff = Pixel2MTU(5);
	// Adding text into the shape
	excelShape.RichText.Add(text);
}

public int Pixel2MTU(int pixels)
{
	int mtus = pixels * 9525;
	return mtus;
}
最终导出的 Excel 文件
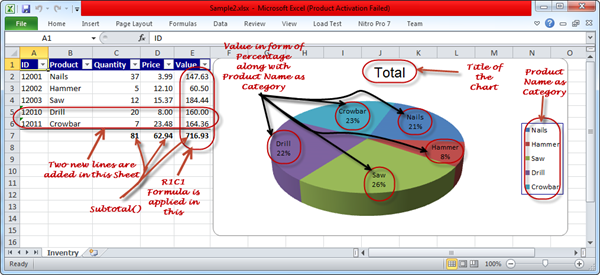
10. 从现有 Excel 工作表或模板创建新的 Excel 工作表
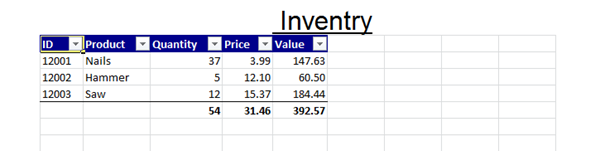
现在,我们将使用本文章的扩展版中获取的现有 Excel 工作表。现有 Excel 工作表的名称是“Sample1.xlsx”。现在我们将通过从“Sample1.xlsx”获取值并添加一些新值来创建“Sample2.xlsx”。
这是“Sample1.xlsx”
现在,看看如何实现
// Taking existing file: 'Sample1.xlsx'. Here 'Sample1.xlsx' is treated as template file
FileInfo templateFile = new FileInfo(@"Sample1.xlsx");
// Making a new file 'Sample2.xlsx'
FileInfo newFile = new FileInfo(@"Sample2.xlsx");

// If there is any file having same name as 'Sample2.xlsx', then delete it first
if (newFile.Exists)
{
	newFile.Delete();
	newFile = new FileInfo(@"Sample2.xlsx");
}

using (ExcelPackage package = new ExcelPackage(newFile, templateFile))
{
	// Openning first Worksheet of the template file i.e. 'Sample1.xlsx'
	ExcelWorksheet worksheet = package.Workbook.Worksheets[1];
	// I'm adding 5th & 6th rows as 1st to 4th rows are already filled up with values in 'Sample1.xlsx'
	worksheet.InsertRow(5, 2);

	// Inserting values in the 5th row
	worksheet.Cells["A5"].Value = "12010";
	worksheet.Cells["B5"].Value = "Drill";
	worksheet.Cells["C5"].Value = 20;
	worksheet.Cells["D5"].Value = 8;

	// Inserting values in the 6th row
	worksheet.Cells["A6"].Value = "12011";
	worksheet.Cells["B6"].Value = "Crowbar";
	worksheet.Cells["C6"].Value = 7;
	worksheet.Cells["D6"].Value = 23.48;
}
11. 在 Excel 单元格中添加“R1C1”公式
现在,我们将为“Value”列(即“E”列)添加公式,因为 E 列中的值来自于“Quantity”列和“Price”列的乘积,正如您在上面Sample1.xlsx的图片中看到的。在本文章的扩展版中,我已说明了如何在此处添加基本公式。所以,我希望您现在能够添加基本公式了 :) 现在,我们将看看如何添加“R1C1”公式。如果您不知道它是什么,请点击此处...我在这里等您 :) 让我们看看
worksheet.Cells["E2:E6"].FormulaR1C1 = "RC[-2]*RC[-1]";
只需一行代码,非常简单 :)
12. 在 Excel 工作表中添加“命名范围”
您不知道“Excel 命名范围”?没问题,只需在此处阅读几行文字。我们可以按以下方式添加命名范围
var name = worksheet.Names.Add("SubTotalName", worksheet.Cells["C7:E7"]);
通过以下方式,我们可以将任何公式添加到命名范围
name.Formula = "SUBTOTAL(9, C2:C6)";
13. 在 Excel 工作表中添加饼图
在此处阅读有关 Excel 图表的信息。
在此处阅读有关饼图的信息。
EPPlus 库支持以下类型的图表
- Area
- Area3D
- AreaStacked
- AreaStacked100
- AreaStacked1003D
- AreaStacked3D
- BarClustered
- BarClustered3D
- BarOfPie
- BarStacked
- BarStacked100
- BarStacked1003D
- BarStacked3D
- Bubble
- Bubble3DEffect
- Column3D
- ColumnClustered
- ColumnClustered3D
- ColumnStacked
- ColumnStacked100
- ColumnStacked1003D
- ColumnStacked3D
- ConeBarClustered
- ConeBarStacked
- ConeBarStacked100
- ConeCol
- ConeColClustered
- ConeColStacked
- ConeColStacked100
- CylinderBarClustered
- CylinderBarStacked
- CylinderBarStacked100
- CylinderCol
- CylinderColClustered
- CylinderColStacked
- CylinderColStacked100
- Doughnut
- DoughnutExploded
- Line
- Line3D
- LineMarkers
- LineMarkersStacked
- LineMarkersStacked100
- LineStacked
- LineStacked100
- Pie
- Pie3D
- PieExploded
- PieExploded3D
- PieOfPie
- PyramidBarClustered
- PyramidBarStacked
- PyramidBarStacked100
- PyramidCol
- PyramidColClustered
- PyramidColStacked
- PyramidColStacked100
- Radar
- RadarFilled
- RadarMarkers
- StockHLC
- StockOHLC
- StockVHLC
- StockVOHLC
- 表面
- SurfaceTopView
- SurfaceTopViewWireframe
- SurfaceWireframe
- XYScatter
- XYScatterLines
- XYScatterLinesNoMarkers
- XYScatterSmooth
- XYScatterSmoothNoMarkers
首先,您需要添加
OfficeOpenXml.Drawing.Chart 命名空间来处理图表。现在请看下面的代码
// Adding namespace to work with Chart
using OfficeOpenXml.Drawing.Chart;

// Adding Pie Chart to the Worksheet and assigning it in a variable 'chart'
var chart = (worksheet.Drawings.AddChart("PieChart", OfficeOpenXml.Drawing.Chart.eChartType.Pie3D) as ExcelPieChart);
设置图表的标题文本
chart.Title.Text = "Total";
设置图表位置:距离第一行第五列 5 像素偏移
chart.SetPosition(0, 0, 5, 5);
设置图表区域的宽度和高度
chart.SetSize(600, 300);
在饼图中,值将来自“Value”列,类别名称来自“Product”列,看看如何实现
ExcelAddress valueAddress = new ExcelAddress(2, 5, 6, 5);
var ser = (chart.Series.Add(valueAddress.Address, "B2:B6") as ExcelPieChartSerie);
设置图表属性
// To show the Product name within the Pie Chart along with value
chart.DataLabel.ShowCategory = true;
// To show the value in form of percentage
chart.DataLabel.ShowPercent = true;
格式化图表的样式
chart.Legend.Border.LineStyle = eLineStyle.Solid;
chart.Legend.Border.Fill.Style = eFillStyle.SolidFill;
chart.Legend.Border.Fill.Color = Color.DarkBlue;
最终导出的 Excel 在此
声明
请下载源代码以获取详细信息。我希望您能理解,因为源代码有注释。如有任何疑问,请在下方发表评论。谢谢。
历史
- 2013 年 11 月 11 日:首次发布
- 2013 年 11 月 13 日:添加了本文章扩展版的链接。
- 2013 年 11 月 14 日:扩展版更新:添加了本文章的链接。
- 2013 年 11 月 14 日:添加了 4 项内容
- 下一版本:我将告诉您如何锁定 Excel 单元格、如何创建加密 Excel 文件、Excel 数据透视表等等。